U.S. Petroleum Weekly – December 9, 2010
(For The Week Ending December 03, 2010)
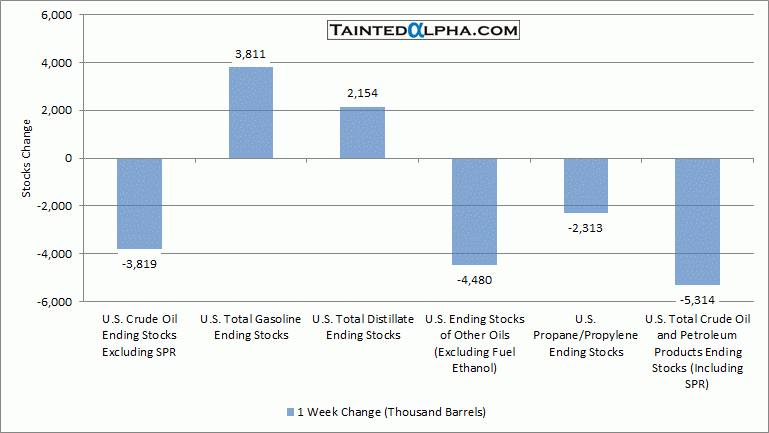
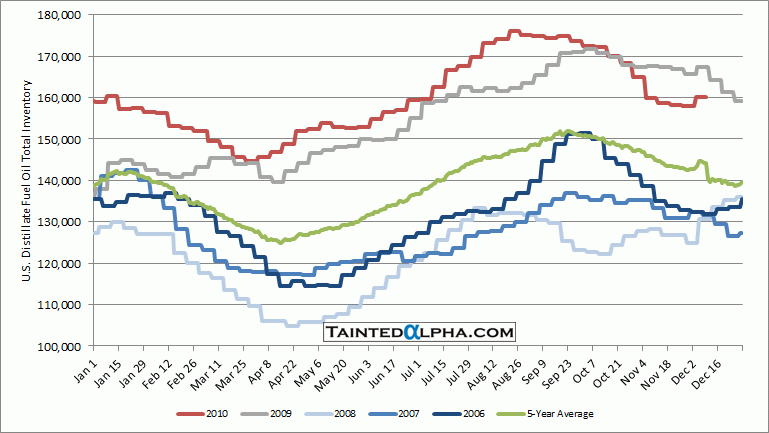
Crude oil stocks fell 3.8 million barrels; Gasoline stocks were up 3.8 million barrels; Distillate stocks rose 2.2 million barrels; Propane/propylene stocks fell 2.3 million barrels; Other oils stocks decreased 4.5 million barrels; Total crude oil and petroleum stocks fell 5.3 million barrels for the week.
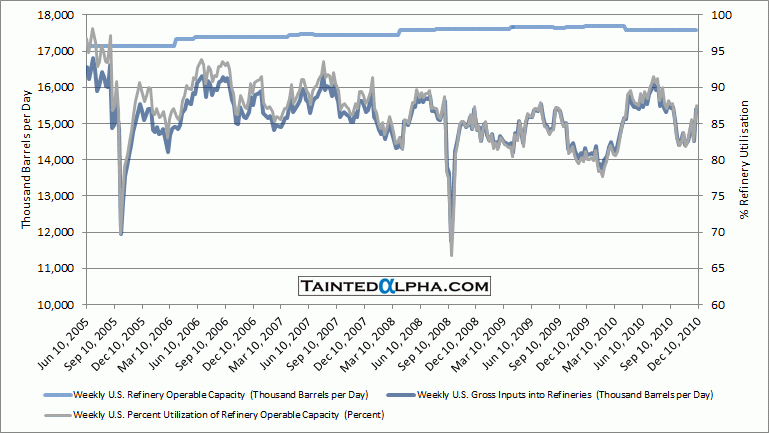
Refinery utilization rose 4.9% to 87.5%.
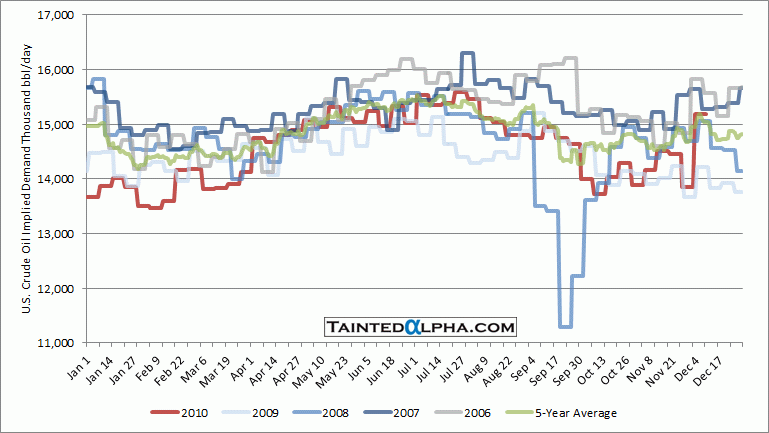
Implied crude oil demand rose 1.3 million barrels.
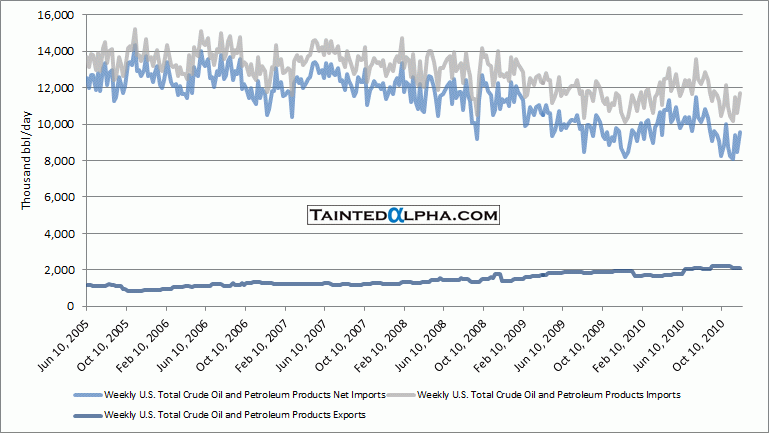
Crude oil and petroleum product net imports rose 1.1 million barrels to 9.6 million barrels.
Kind of mixed report, large temperature related draws, on the other hand large stockpiling of gasoline and distillates. Imports increased and refinery utilization increased, so the risk is on the side of further stock increases.
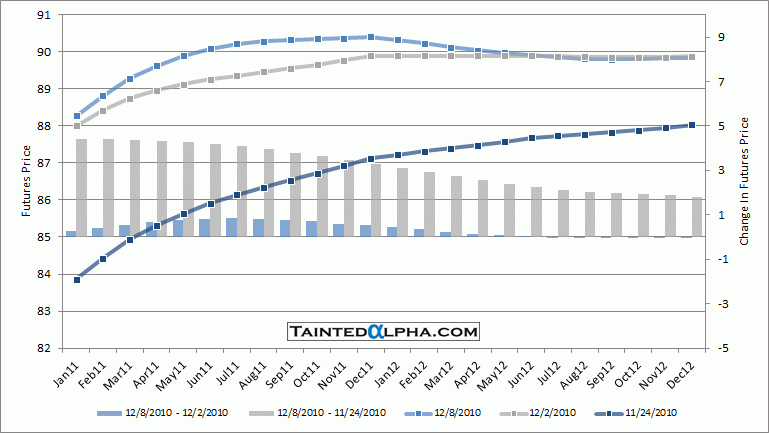
Most important we had large moves in the futures curve; the curve flattened and prices in the mid of the two year curve rose higher than the prices on the end of the curve. This could be big thing and a potential prelude to the curve move into backwardation.
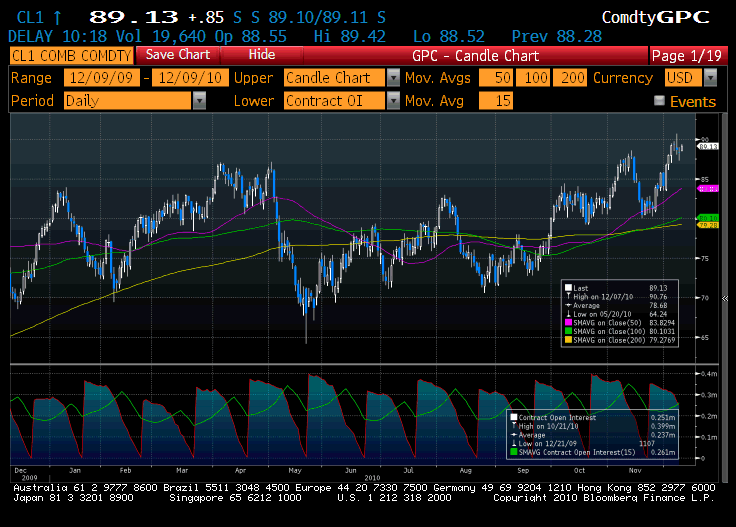
Chart 1. Crude Oil Futures
Chart 2. Crude Oil Futures Curve
Chart 3. Weekly Change in U.S. Crude Oil and Distillates Stocks
Chart 4. U.S. Crude Oil Implied Demand
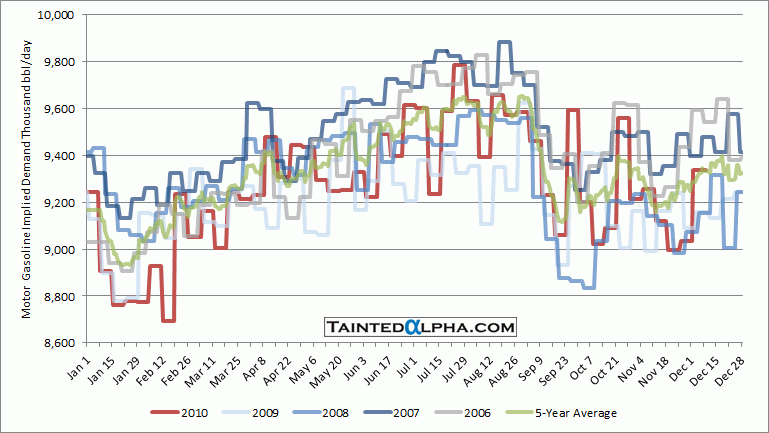
Chart 5. U.S. Motor Gasoline Implied Demand
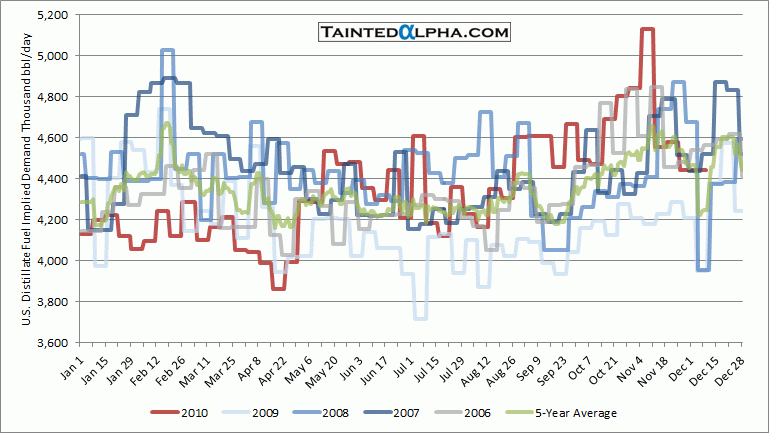
Chart 6. U.S. Distillate Fuel Implied Demand
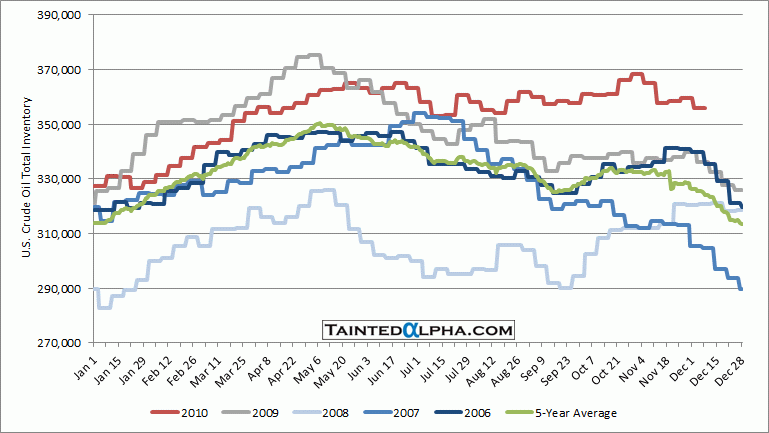
Chart 7. U.S. Crude Oil Total Inventory
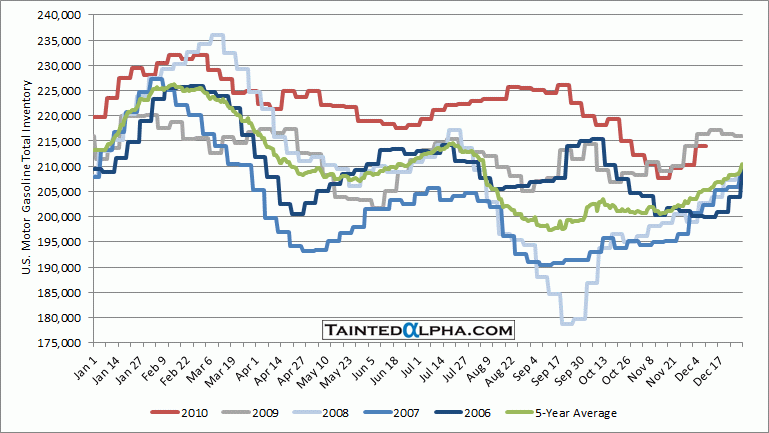
Chart 8. Motor Gasoline Total Inventory
Chart 9. Distillate Fuel Oil Total Inventory
Chart 10. U.S. Refinery Capacity, Inputs, and Production
Chart 11. Weekly U.S. Total Crude Oil and Petroleum Products Imports and Exports
