U.S. Petroleum Weekly – June 10, 2010
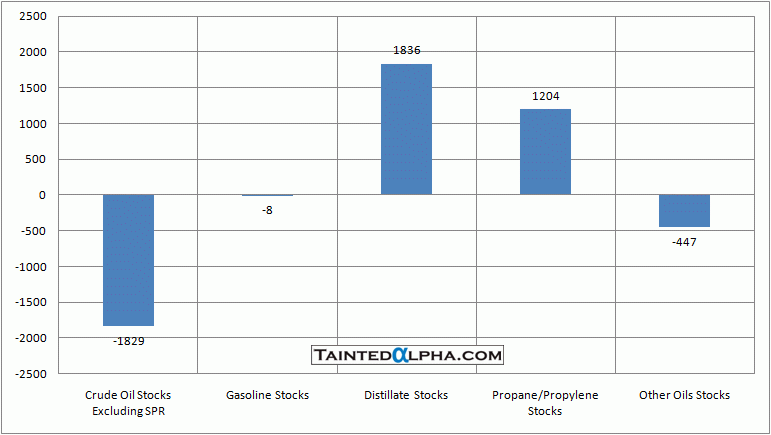
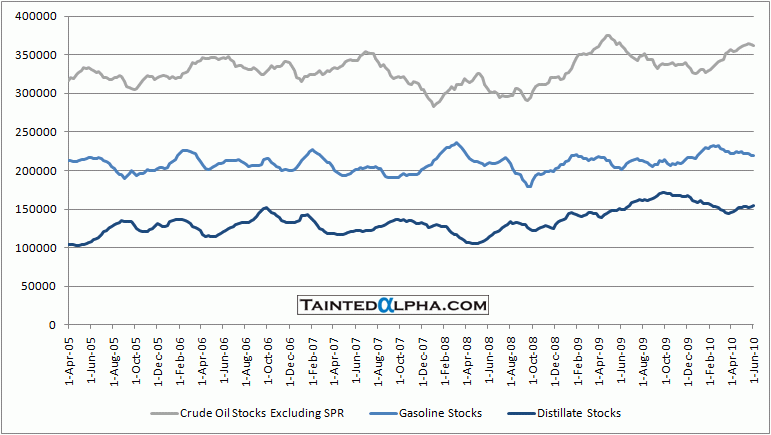
Crude oil stocks fell 1.8 million barrels for week ending June 4; Gasoline stocks remained flat; Distillate stocks increased 1.8 million barrels; Propane/propylene stocks rose 1.2 million barrels; Total crude oil and petroleum stocks were 0.4 million barrels lower than the week before.
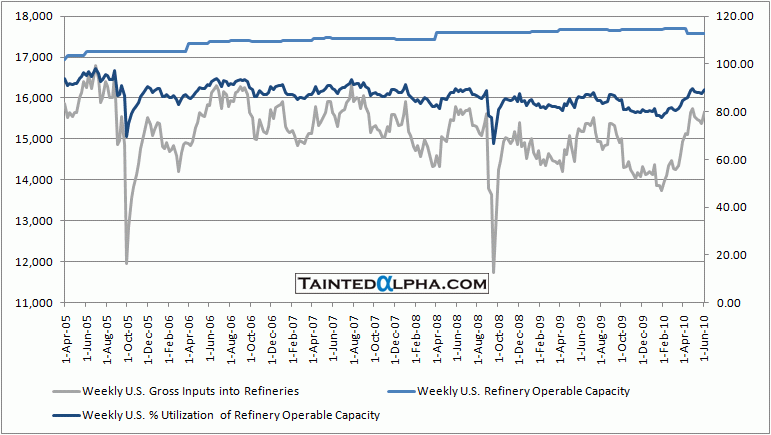
Refinery utilization rose from 87.5% to 89.1%.
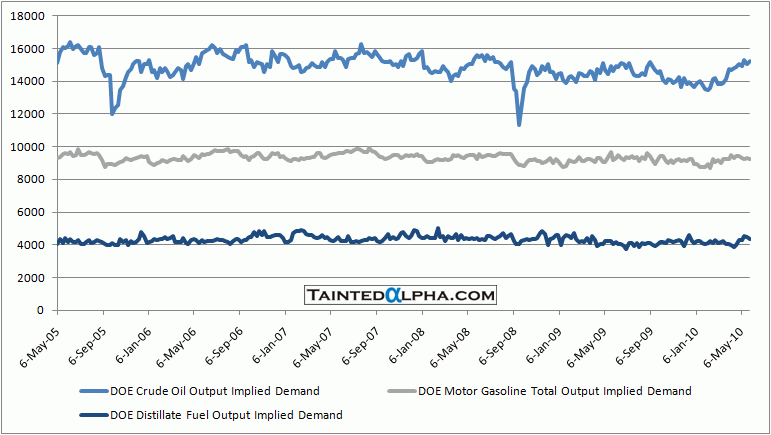
Implied demand flat.
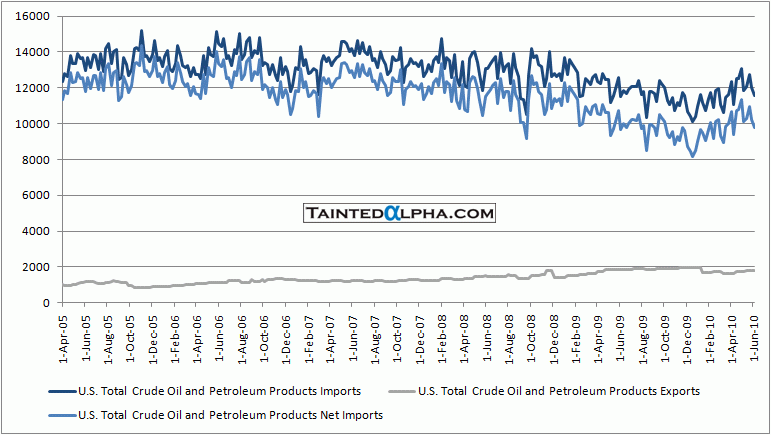
Crude oil and petroleum product net imports fell to 9.8 million barrels. All categories of petroleum stocks are still at extremely elevated levels.
As I wrote yesterday, I expect weaker crude oil price in coming months.
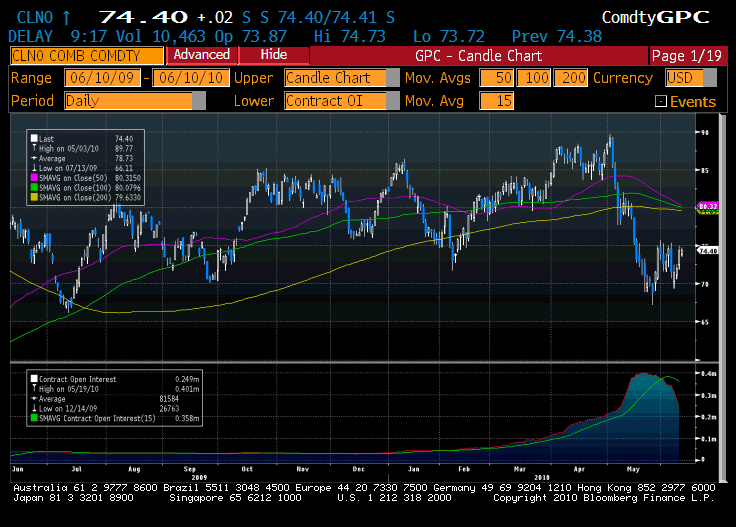
Chart 1. Crude Oil Futures
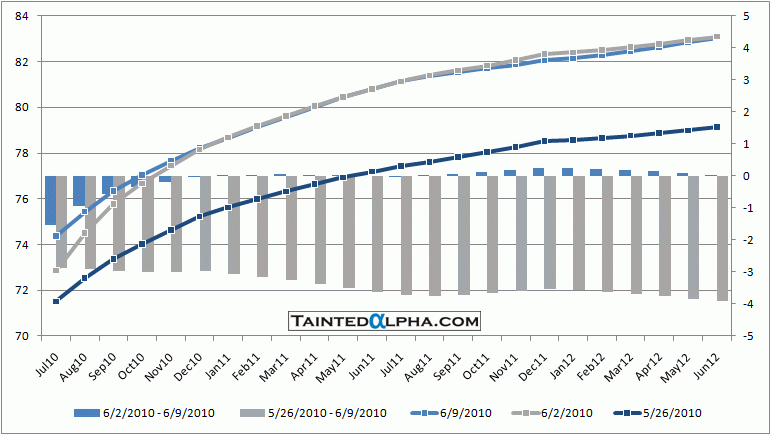
Chart 2. Crude Oil Futures Curve
Chart 3. Weekly Change in U.S. Crude Oil and Distillates Stocks
Chart 4. Crude Oil, Gasoline and Distillate Fuel Implied Demand
Chart 5. U.S. Total Crude Oil, Gasoline and Distillate Ending Stocks
Chart 6. U.S. Refinery Capacity, Inputs, and Production
Chart 7. Weekly U.S. Total Crude Oil and Petroleum Products Imports and Exports
