Charts
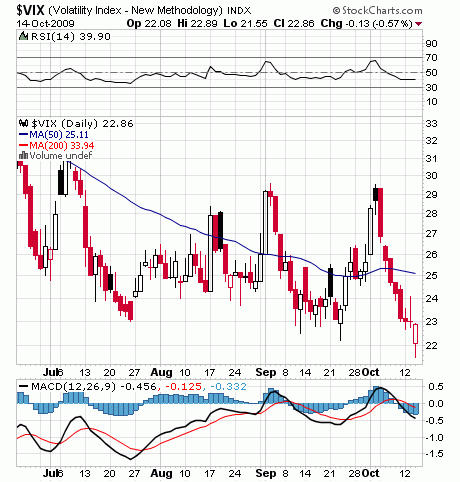
Interesting action with the VIX yesterday, break out to the 52 weeks low and then rebound to the upside. Looks someone was buying insurance after the run yesterday.
Chart 1. VIX
Looking at the 5 year chart the VIX is still at elevated levels; so if the nirvana continues we could see 1X levels.
Chart 2. VIX 5Y Chart
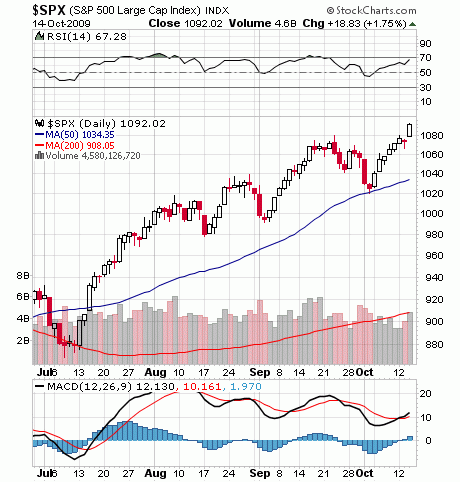
We had a nice move to the upside yesterday in equities mostly on JPM earnings. 80% of the companies have reported earnings above consensus; so we could have some further up moves.
Chart 3. S&P 500
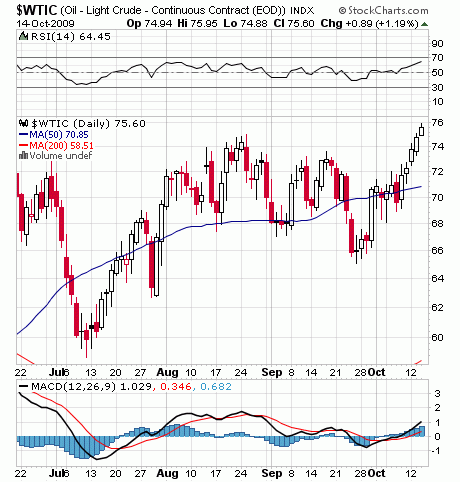
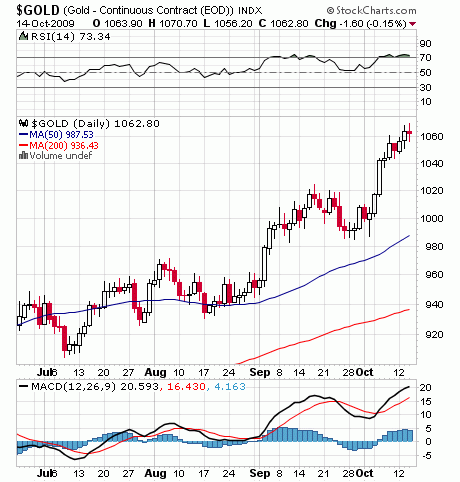
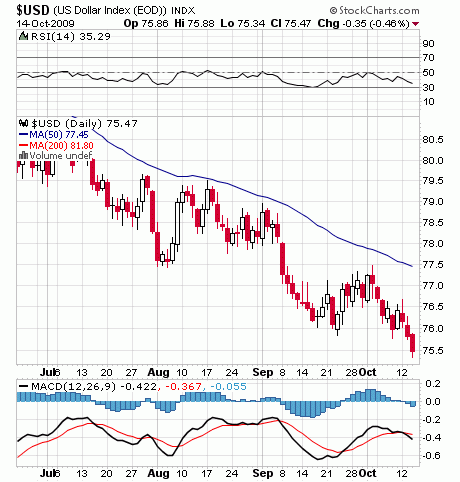
The dollar was down; crude oil was up; gold ended lower. Divergence in U.S. dollar commodity hedge. In my view sign of overbought crude oil.
Chart 4. Crude Oil Futures
Chart 5. Gold Futures
Chart 6. U.S. Dollar Index Futures
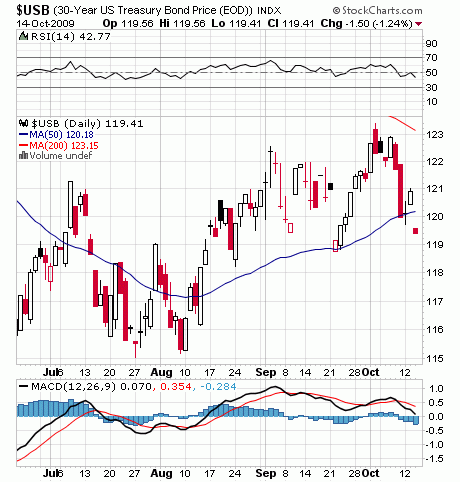
And on the end one of my favorite potential trades: short long end of treasuries curve is starting to gain momentum. Premature in my view; but it’s a perfect setup; asymmetric outcomea to the down side; I definitely see myself playing that, but contrary to the consensus I see deflationary risks more pronounced than inflationary; for the time being.
Chart 7. U.S. Treasury Bond Price
Crude Oil, Gold, S&P 500, U.S. Dollar, U.S. Treasury Bonds, VIX
