U.S. Petroleum Weekly – 22 April 2010
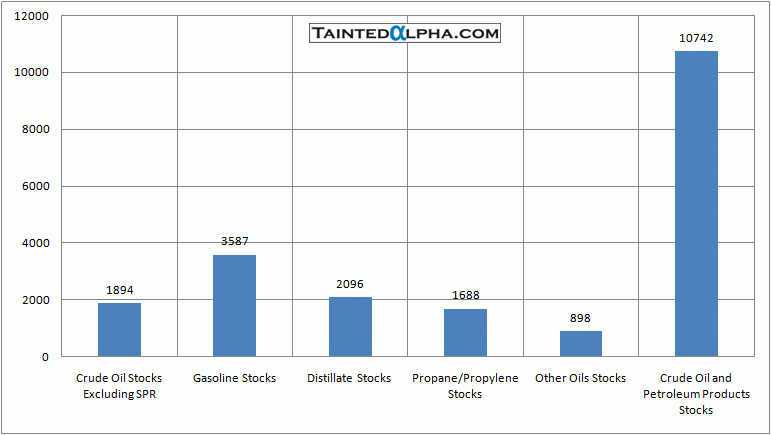
Crude oil stocks rose 1.9 million barrels for week ending 16 April; Gasoline stocks were up 3.6 million barrels; Distillate stocks rose 2.1 million barrels; Propane/propylene stocks increased 1.7 million barrels; Other oils stocks rose 0.9 million barrels; Total crude oil and petroleum stocks were 10.7 million barrels higher than the week before.
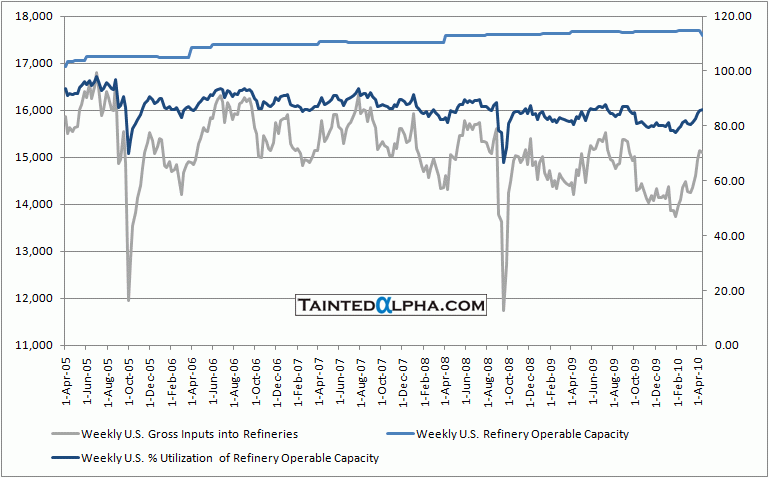
Refinery utilization rose from 85.6% to 85.9%. We are at normal refinery utilization rates.
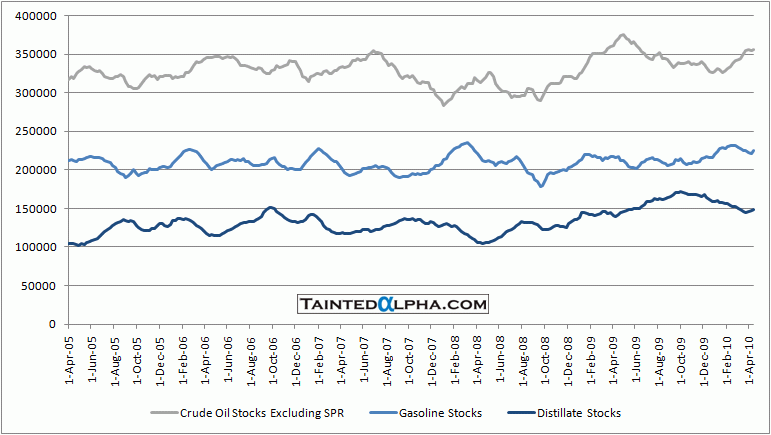
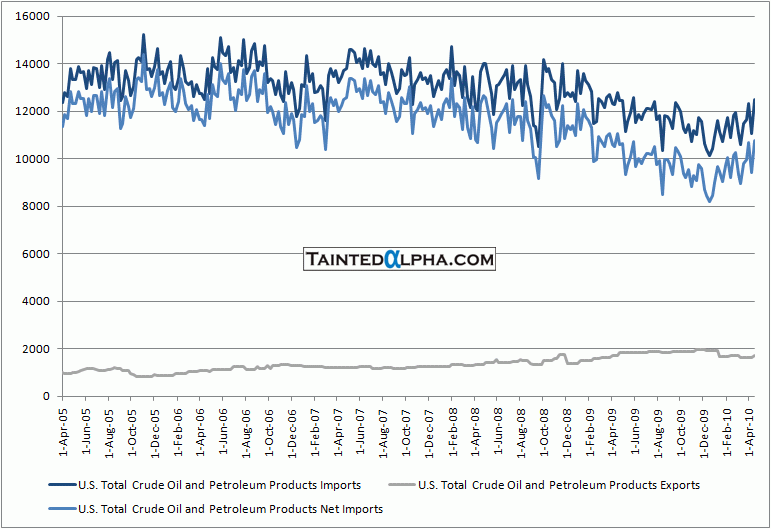
Crude oil and petroleum product net imports were at 10.8 million barrels. All categories of petroleum stocks are still at elevated levels.
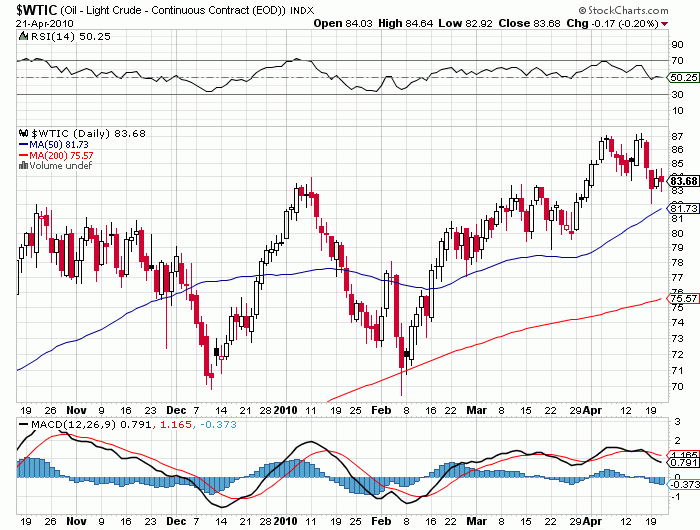
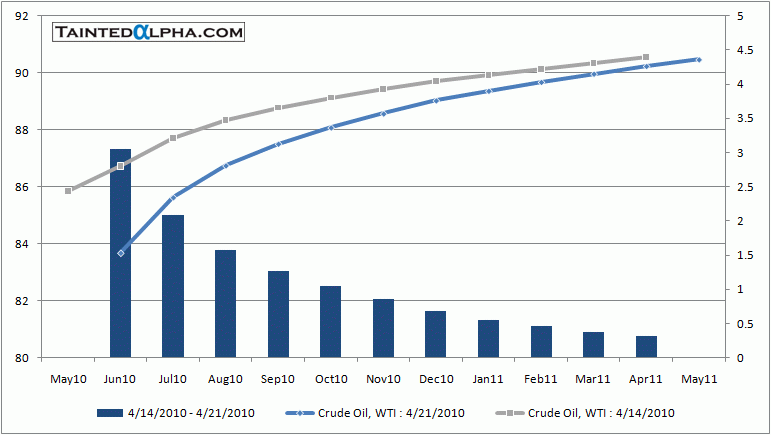
Well, contango and (un)realistic demand expectations are keeping prices this high . When the financial markets experience first hiccup it will go down in a mayor way. I’m short.
Similar thing happening in aluminum (and other commodities). Mr. Deripaska made a statement a few days ago that supply demand dynamics of aluminum market doesn’t determine the metal price anymore because aluminum has become a financial investment. Ha has probably some excess inventory on hand, mildly speaking. FT Alphaville post: Why is Rusal issuing an aluminium ETF? The statement will be probably remembered similar as statements that U.S. housing is not in a bubble and that falling house prices will not affect U.S. financial system made few years ago.
Chart 1. Crude Oil Futures
Chart 2. Crude Oil Futures Curve
Chart 3. Weekly Change in U.S. Crude Oil and Distillates Stocks
Chart 4. U.S. Total Crude Oil, Gasoline and Distillate Ending Stocks
Chart 5. U.S. Refinery Capacity, Inputs, and Production
Chart 6. Weekly U.S. Total Crude Oil and Petroleum Products Imports and Exports
