U.S. Petroleum Weekly – January 27, 2011
(For The Week Ending January 21, 2011)
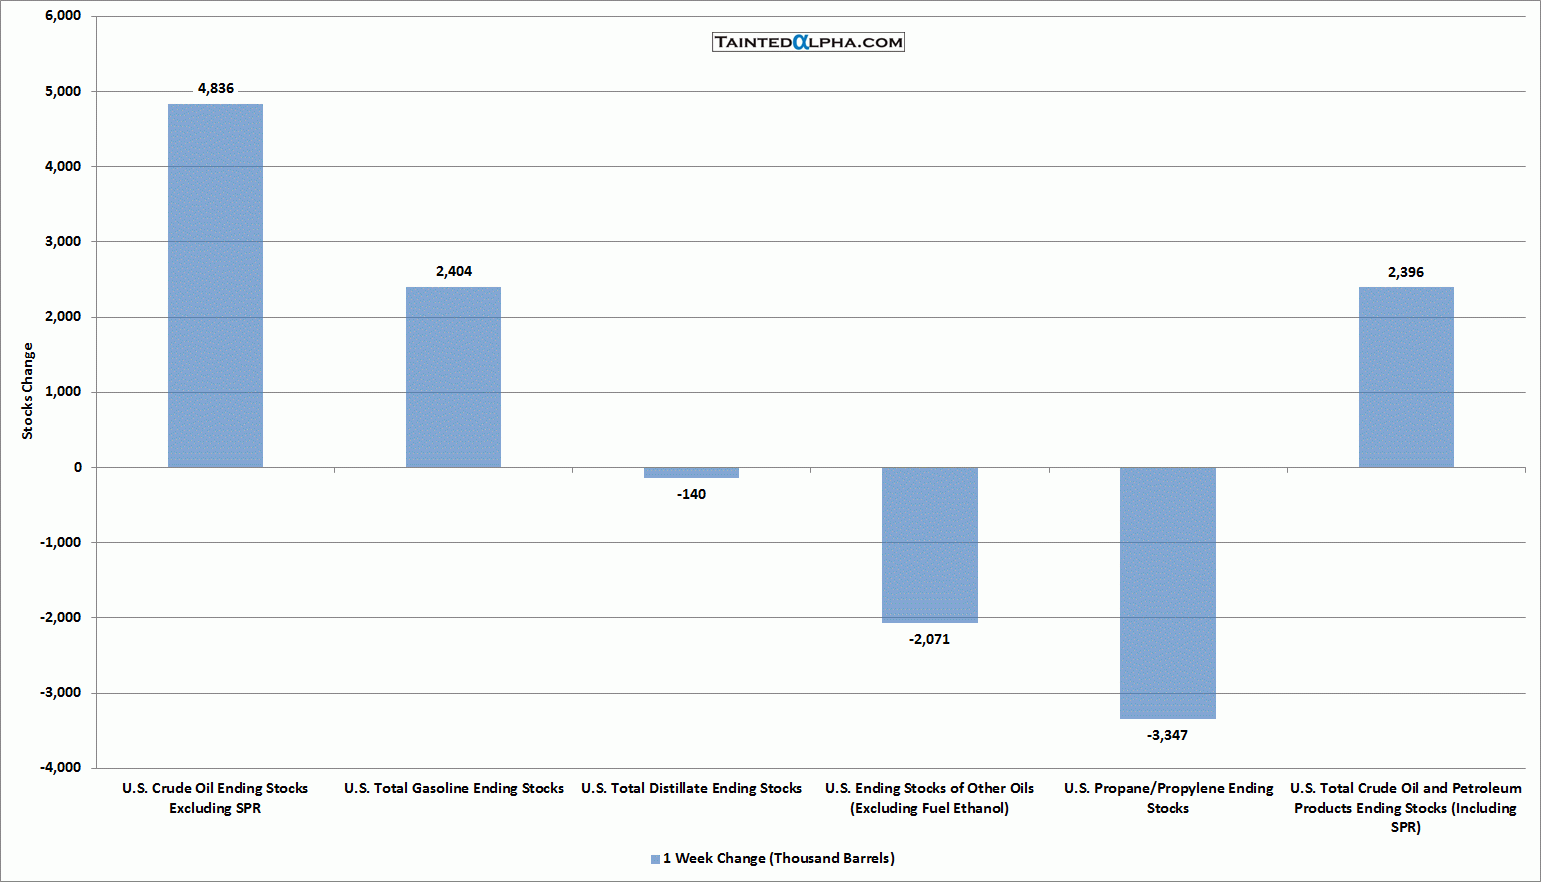
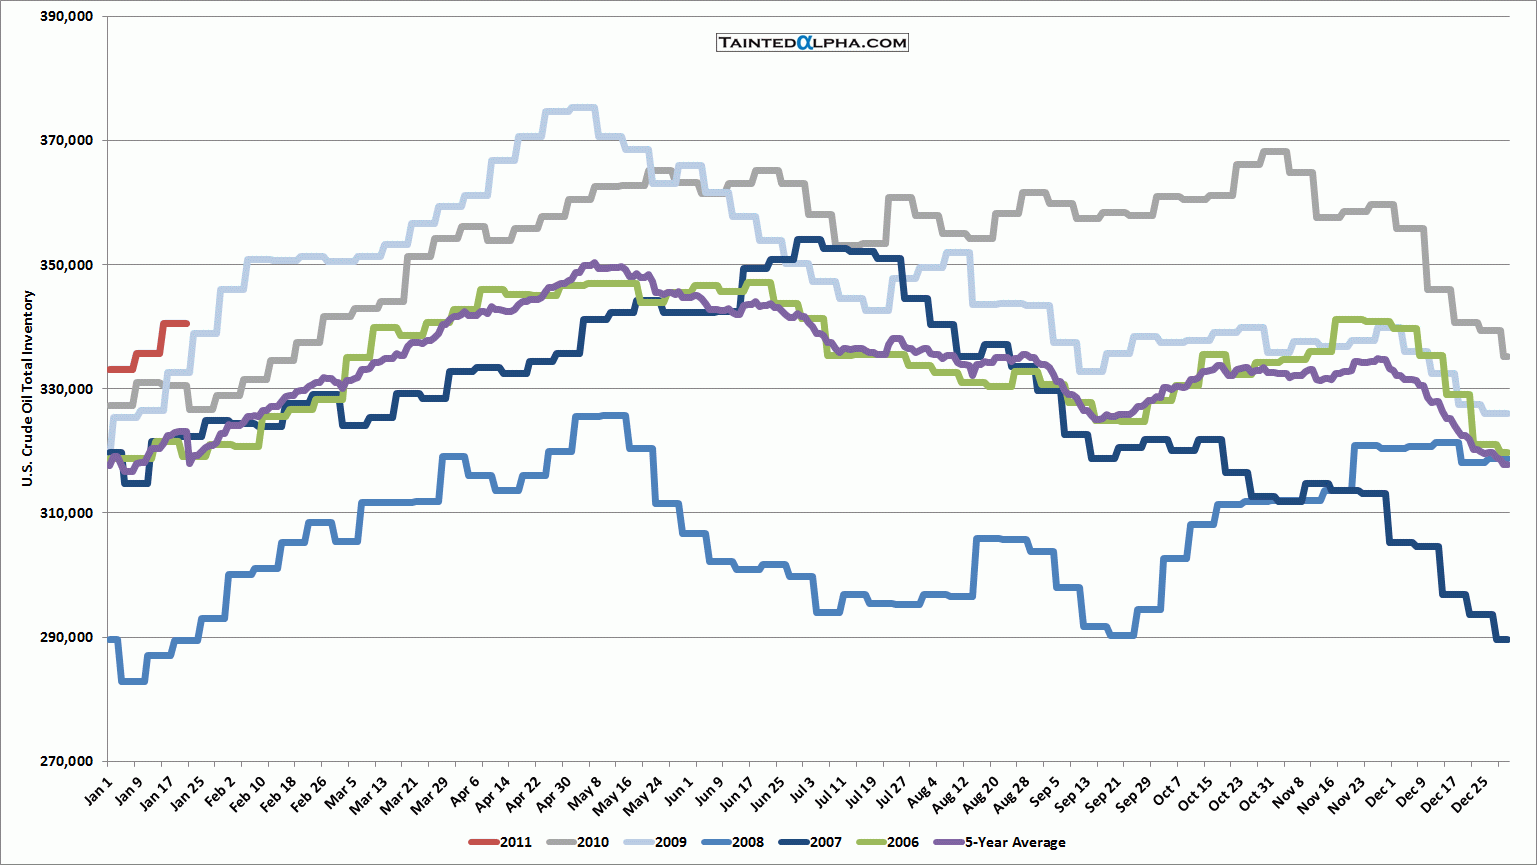
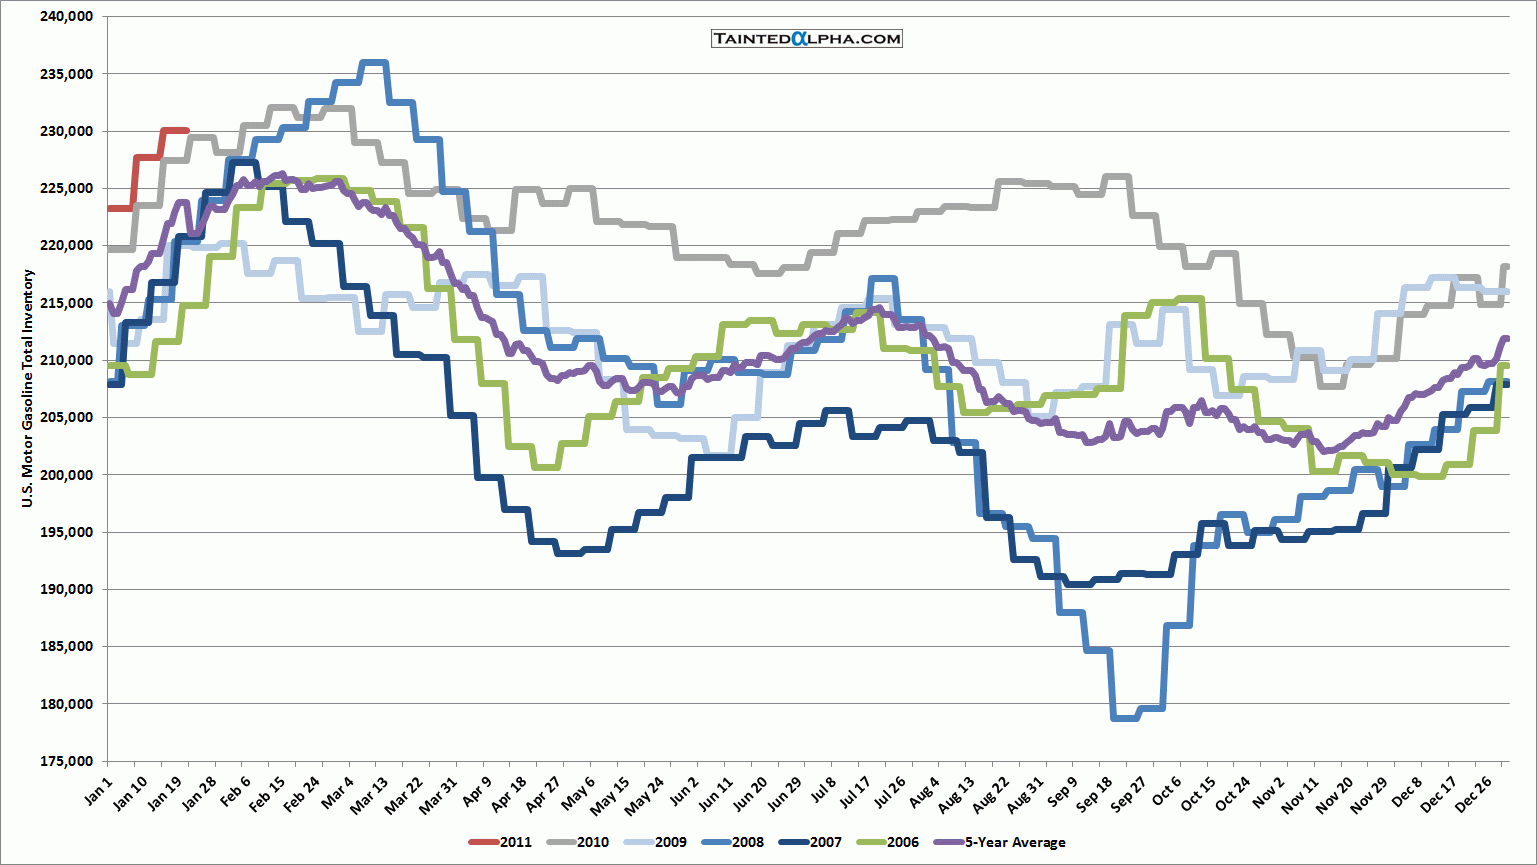
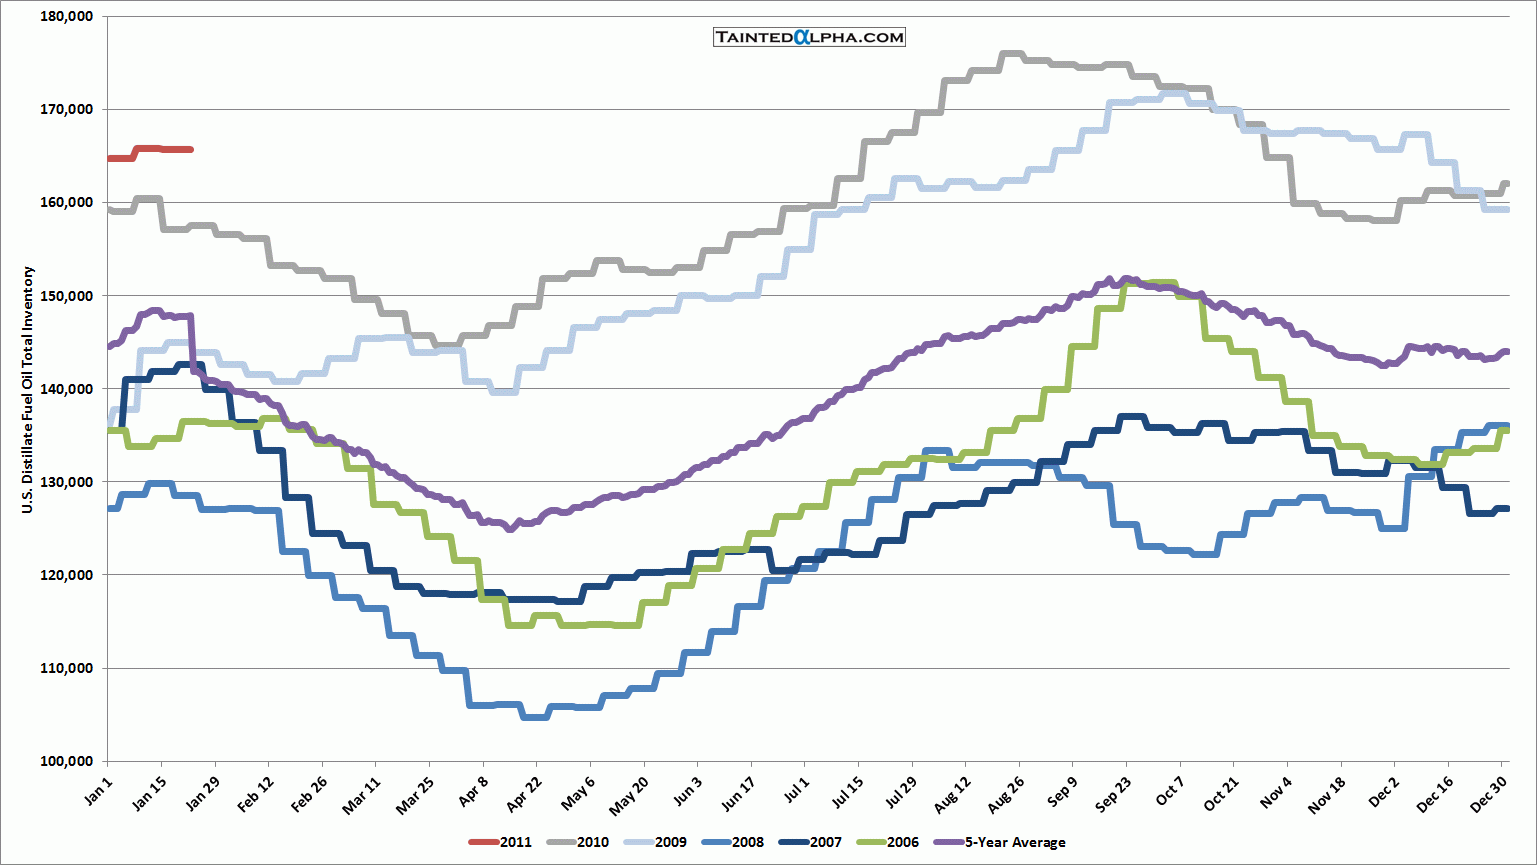
Crude oil stocks rose 4.8 million barrels; Gasoline stocks increased 2.4 million barrels; Distillate stocks fell 0.1 million barrels; Propane/propylene stocks were down 3.3 million barrels; Other oils stocks decreased 2.1 million barrels; Total crude oil and petroleum stocks were 2.4 million barrels higher for the week.
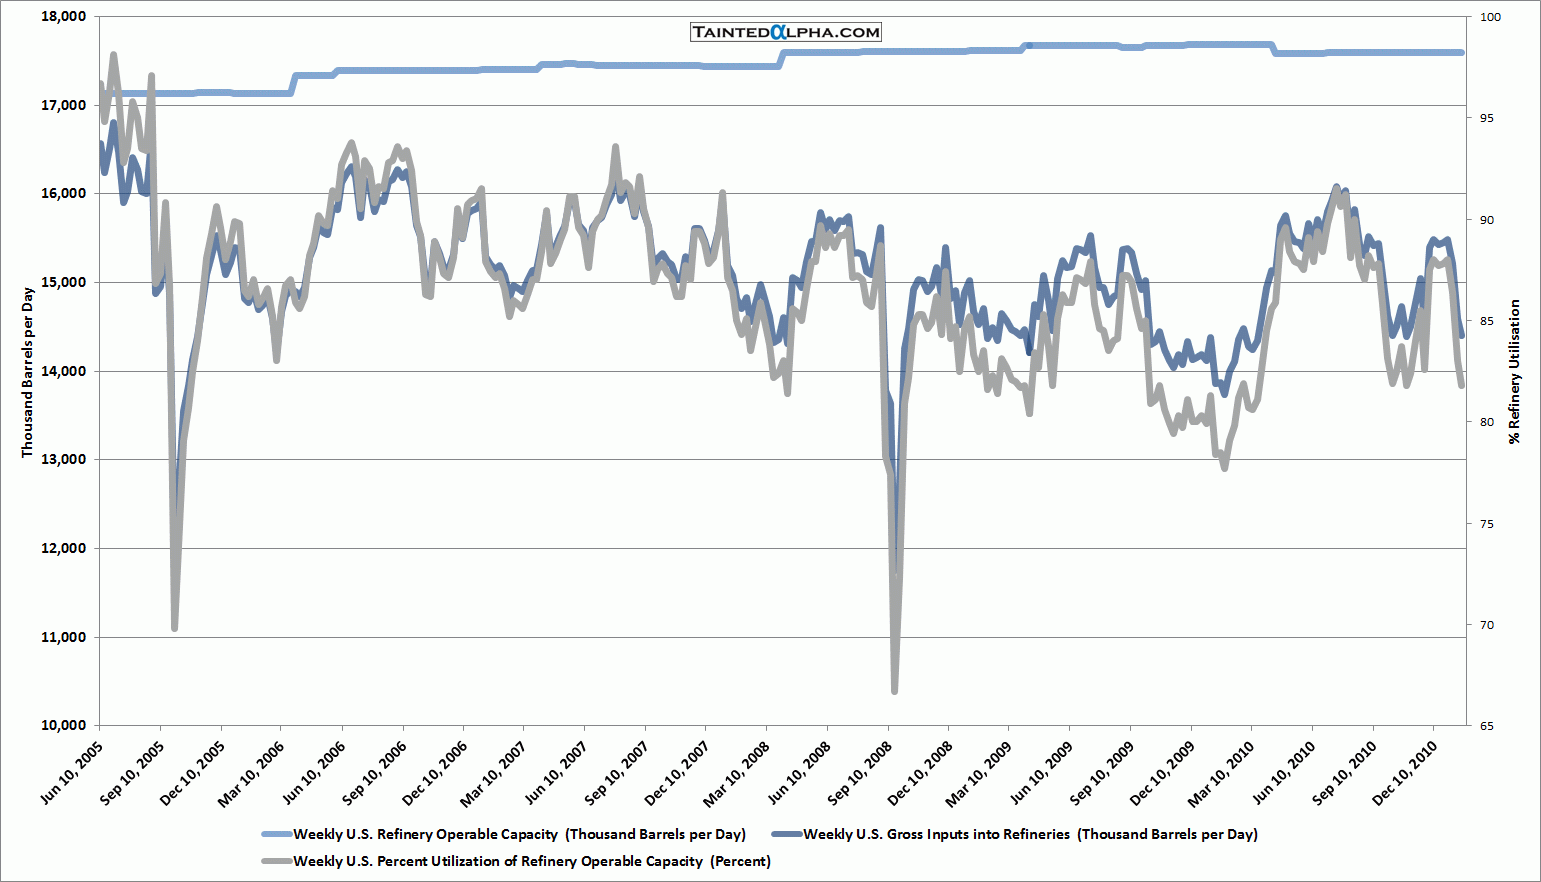
Refinery utilization fell 1.2% to 81.8%.
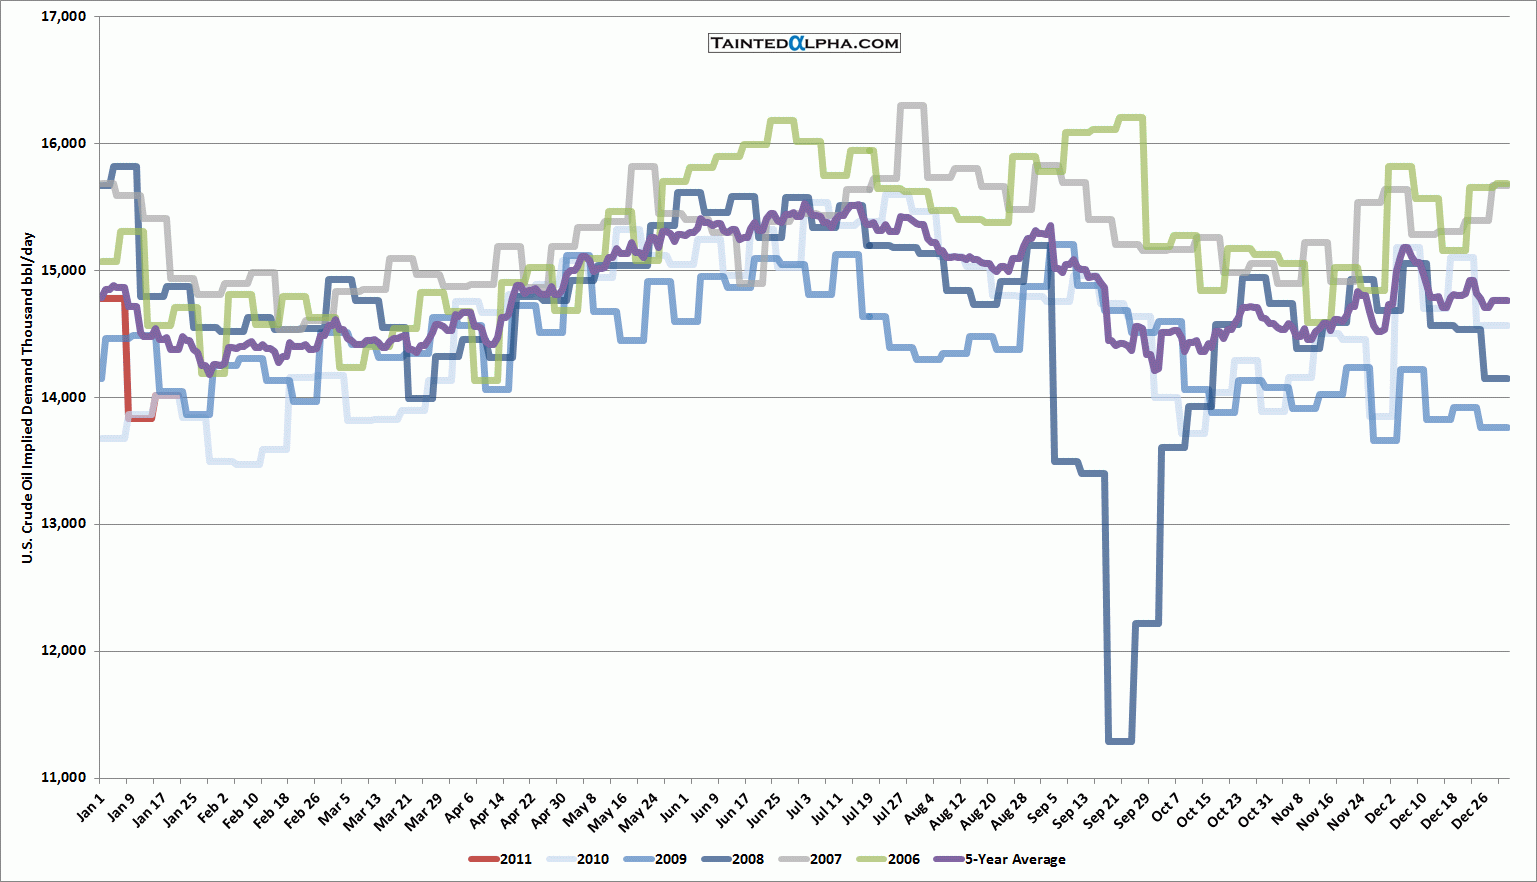
Implied crude oil demand rose 0.2 million barrels.
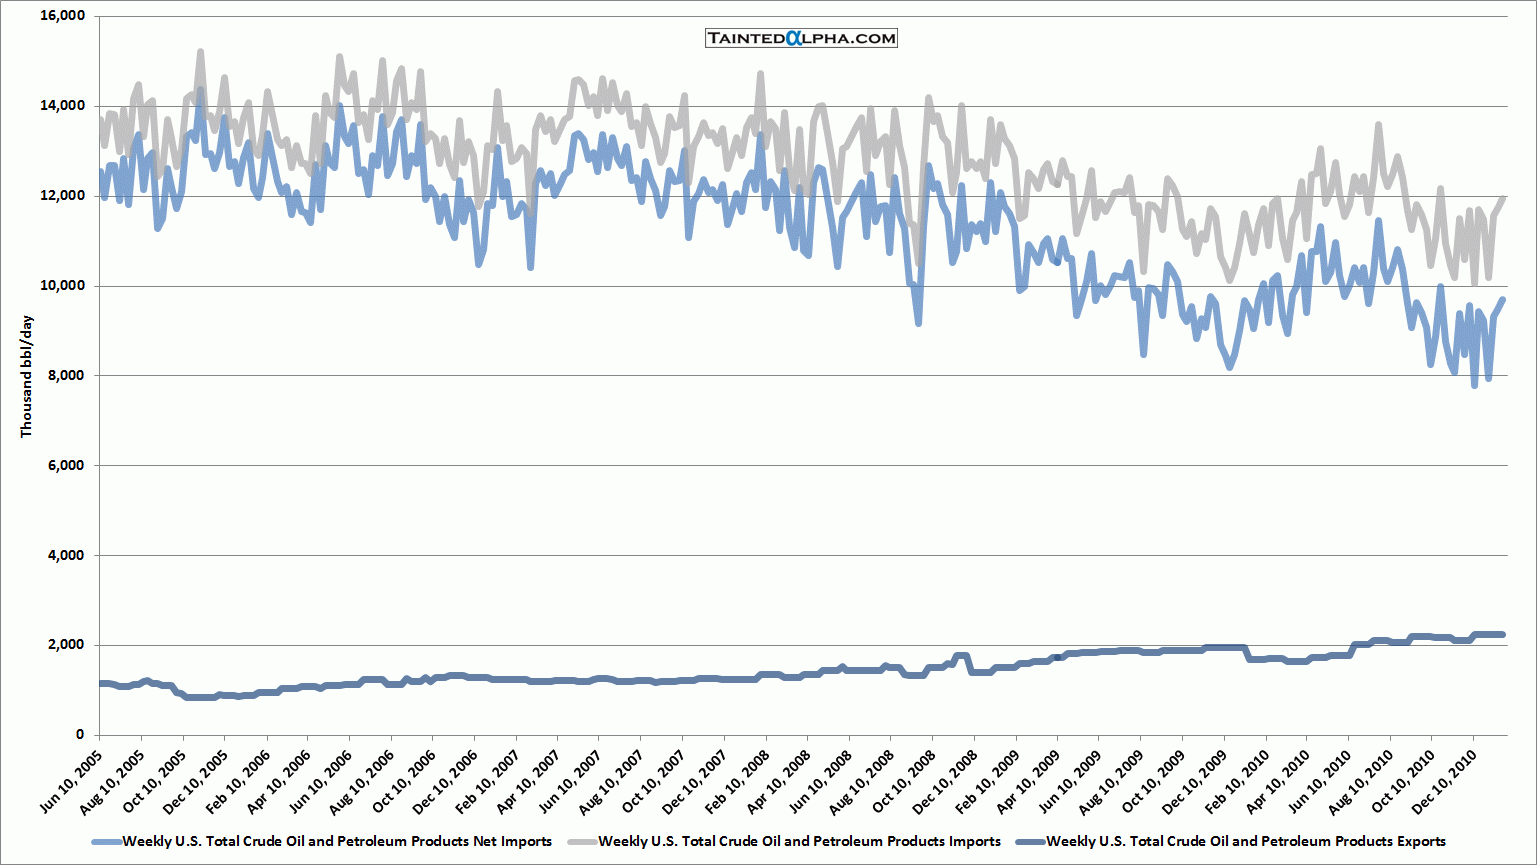
Crude oil and petroleum product net imports rose 0.2 million barrels to 9.7 million barrels.
Crude oil stocks rising, markets well supplied, demand weak.
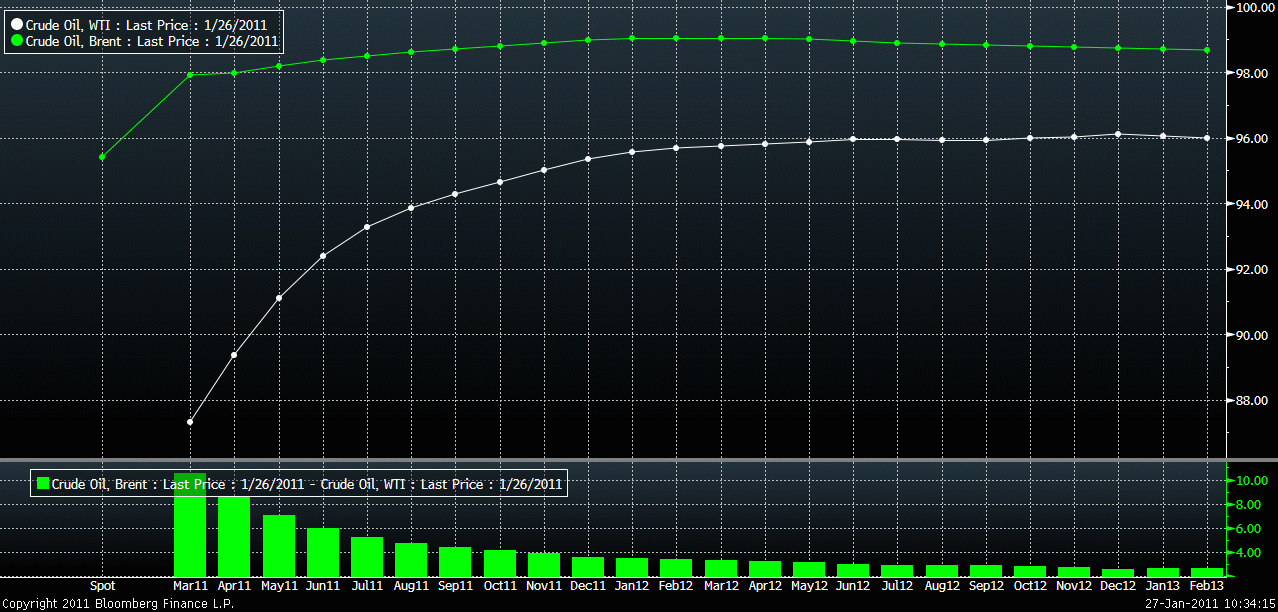
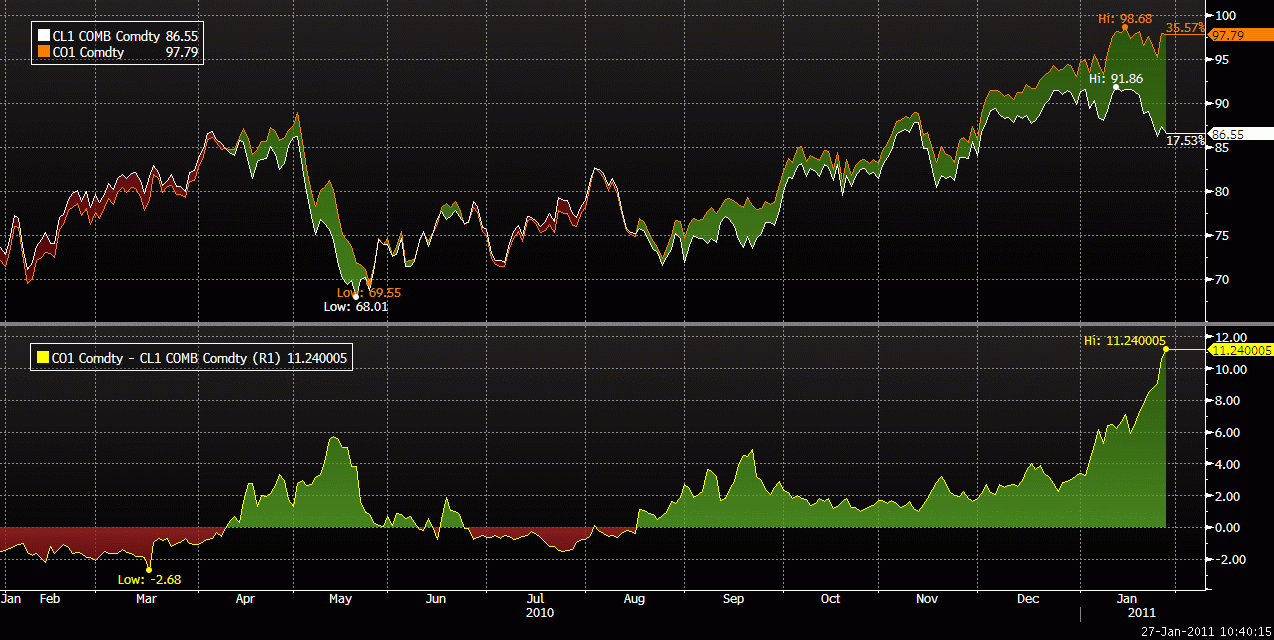
Recent weeks are marked by record WTI vs. Brent crude price spread which is at record high of 11.2 USD per barrel. My best guess is that this is caused by three major factors: oversupplied U.S. market, smaller negative roll yield in Brent (or even positive roll on some contracts), coming CFTC futures position limits.
What this means for the crude oil price? I would say WTI is better proxy for oil price than Brent.
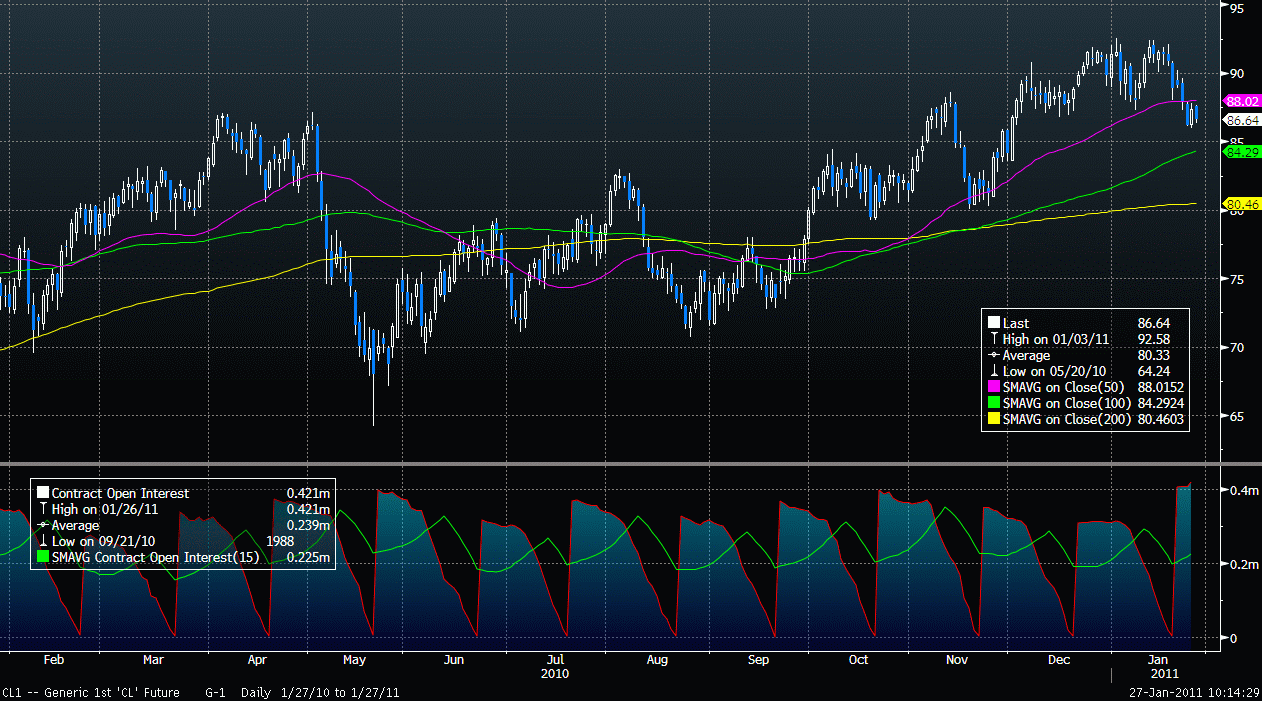
Chart 1. Crude Oil Futures
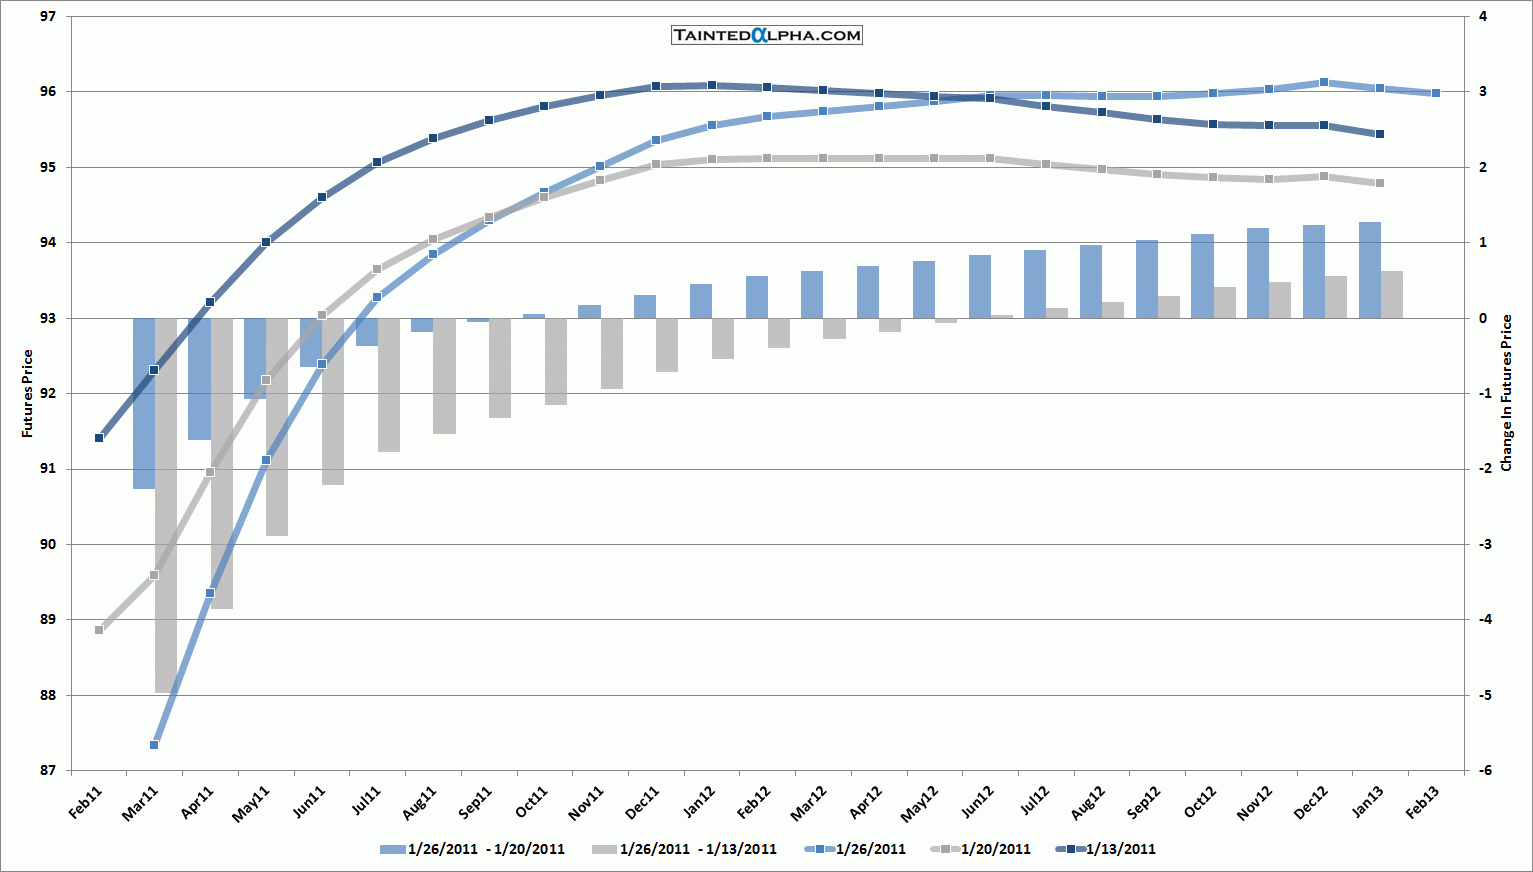
Chart 2. Crude Oil Futures Curve
Chart 3. Crude Oil Futures Curve WTI vs. Brent
Chart 4. WTI vs. Brent Front Month Futures Spread
Chart 5. Weekly Change in U.S. Crude Oil and Distillates Stocks
Chart 6. U.S. Crude Oil Implied Demand
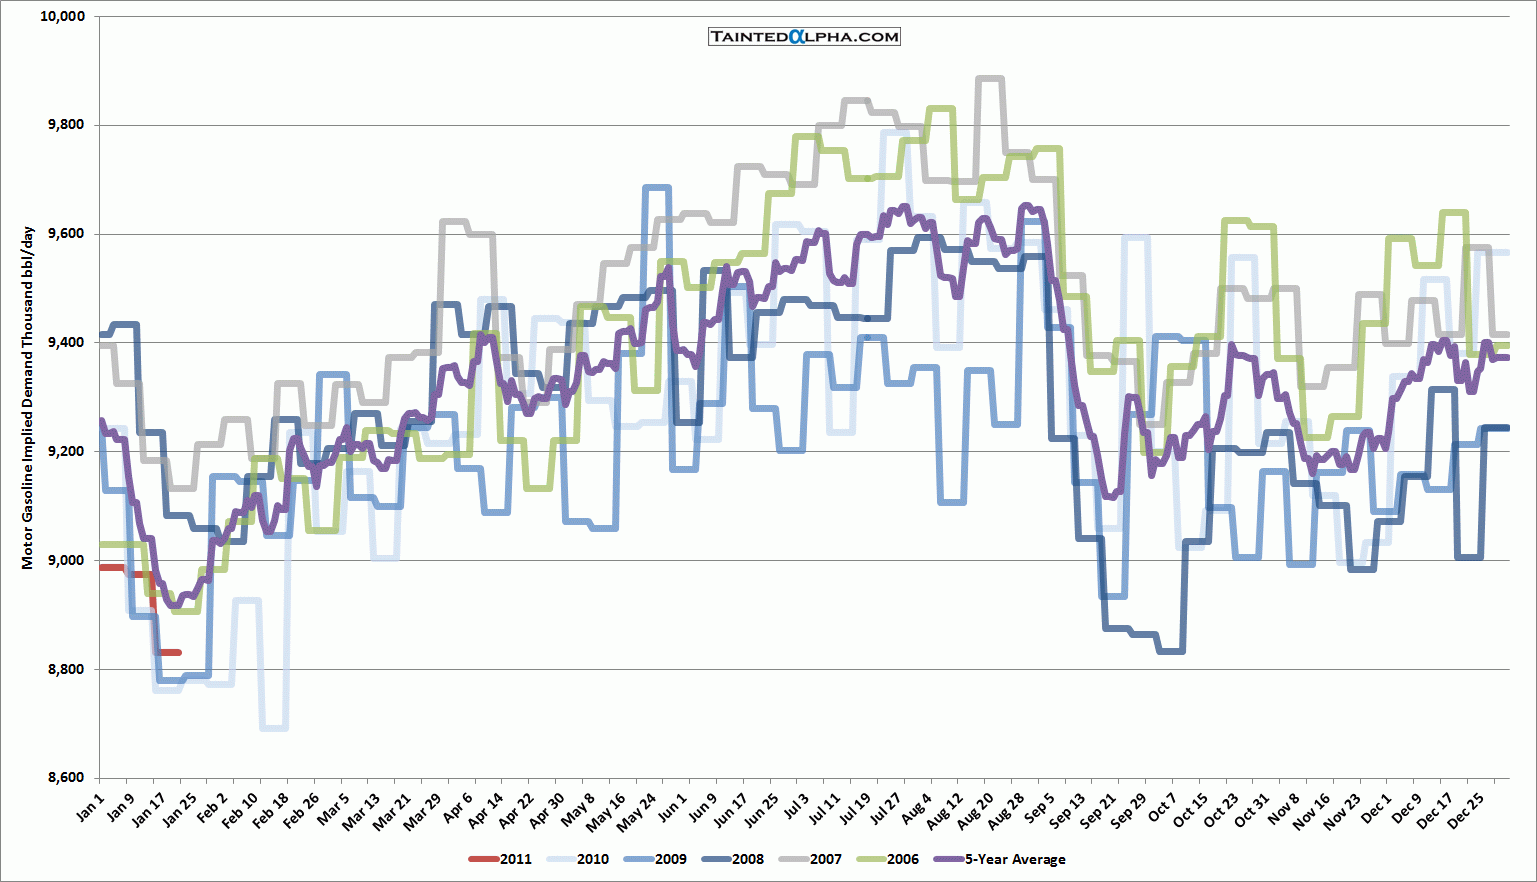
Chart 7. U.S. Motor Gasoline Implied Demand
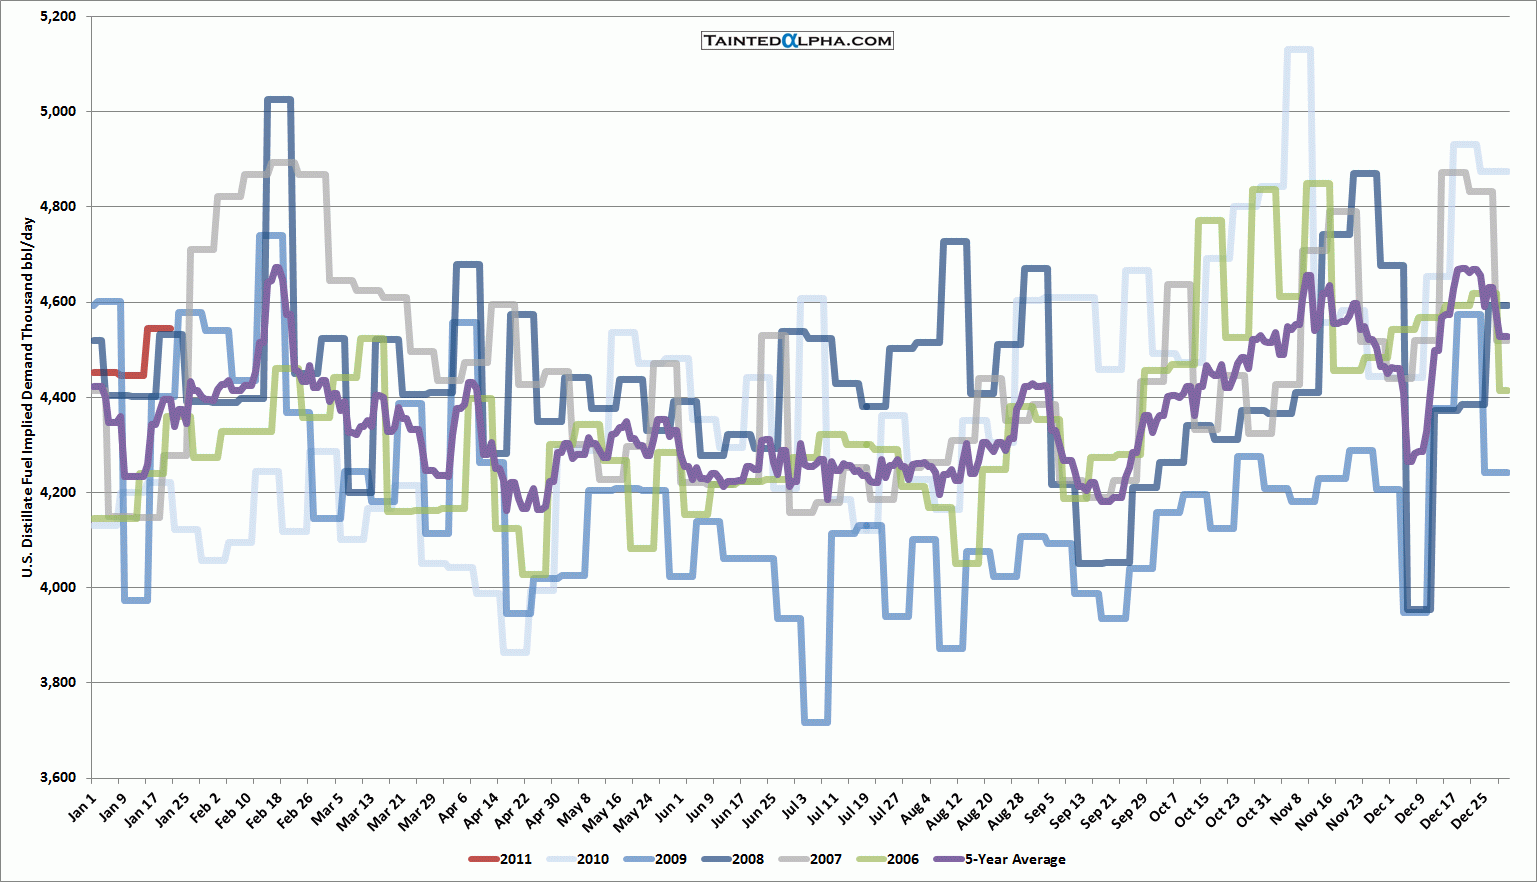
Chart 8. U.S. Distillate Fuel Implied Demand
Chart 9. U.S. Crude Oil Total Inventory
Chart 10. Motor Gasoline Total Inventory
Chart 11. Distillate Fuel Oil Total Inventory
Chart 12. U.S. Refinery Capacity, Inputs, and Production
Chart 13. Weekly U.S. Total Crude Oil and Petroleum Products Imports and Exports
