U.S. Petroleum Weekly – January 13, 2011
(For The Week Ending January 7, 2011)
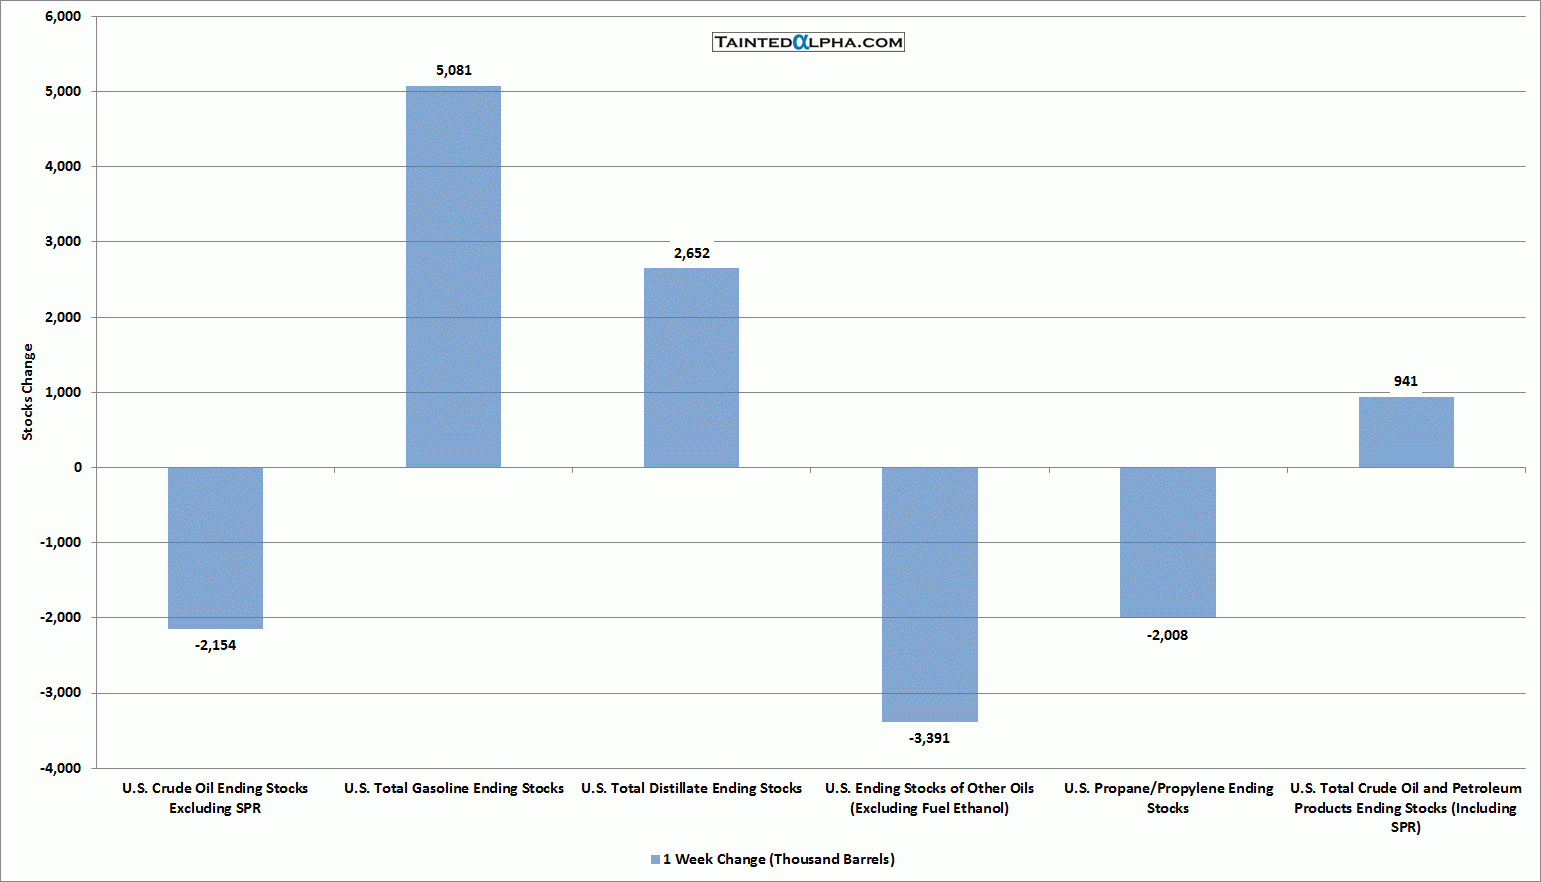
Crude oil stocks fell 2.2 million barrels; Gasoline stocks rose 5.1 million barrels; Distillate stocks were up 2.7 million barrels; Propane/propylene stocks were down 3.4 million barrels; Other oils stocks decreased 3.4 million barrels; Total crude oil and petroleum stocks were 0.9 million barrels higher for the week.
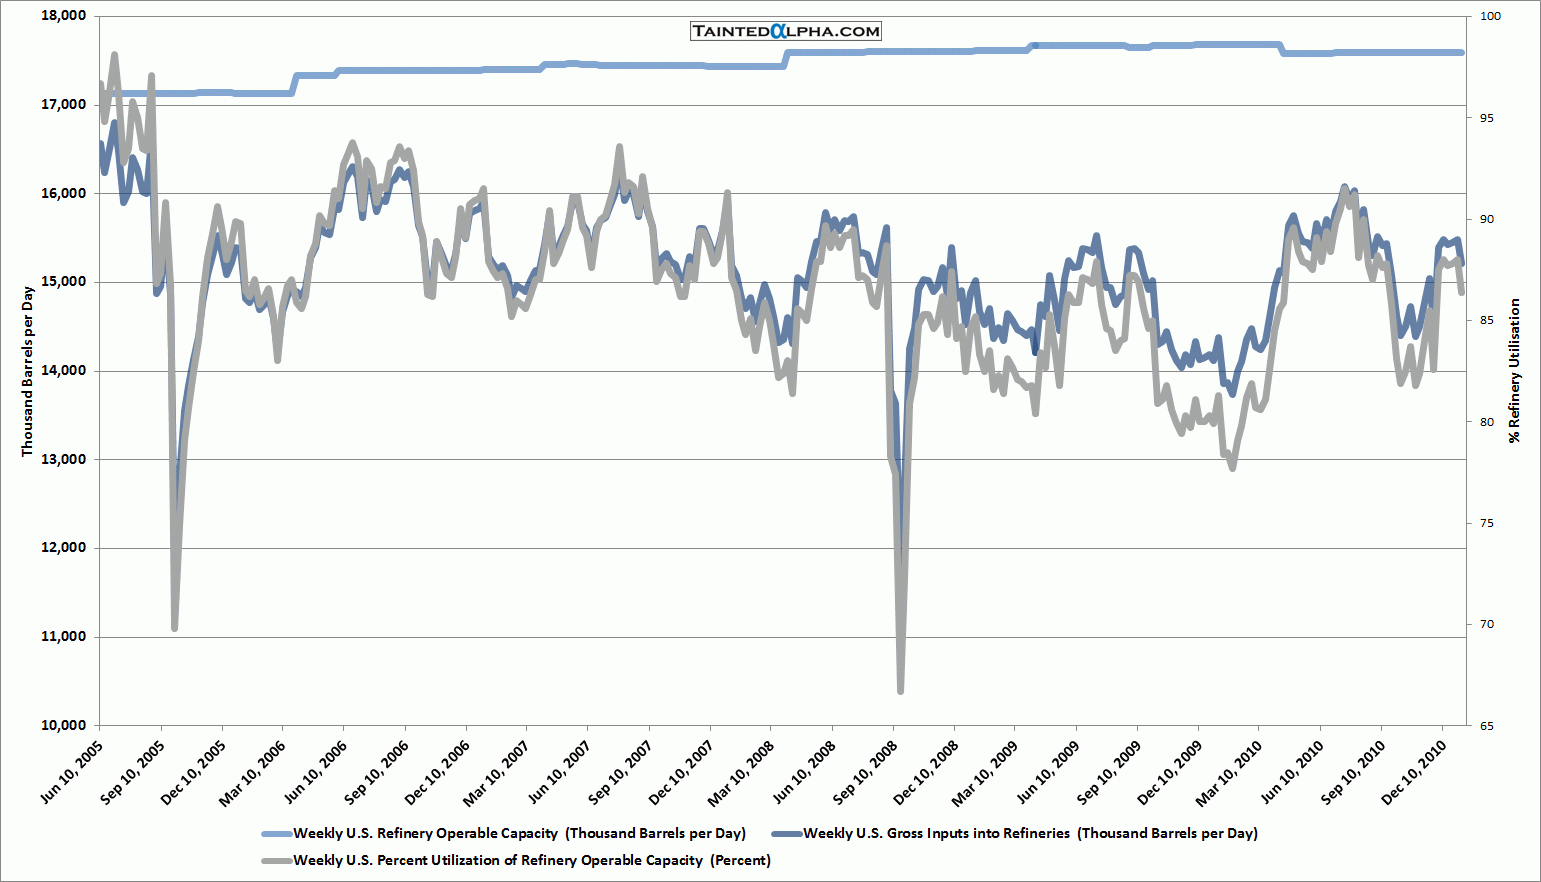
Refinery utilization rose 1.6% to 86.4%.
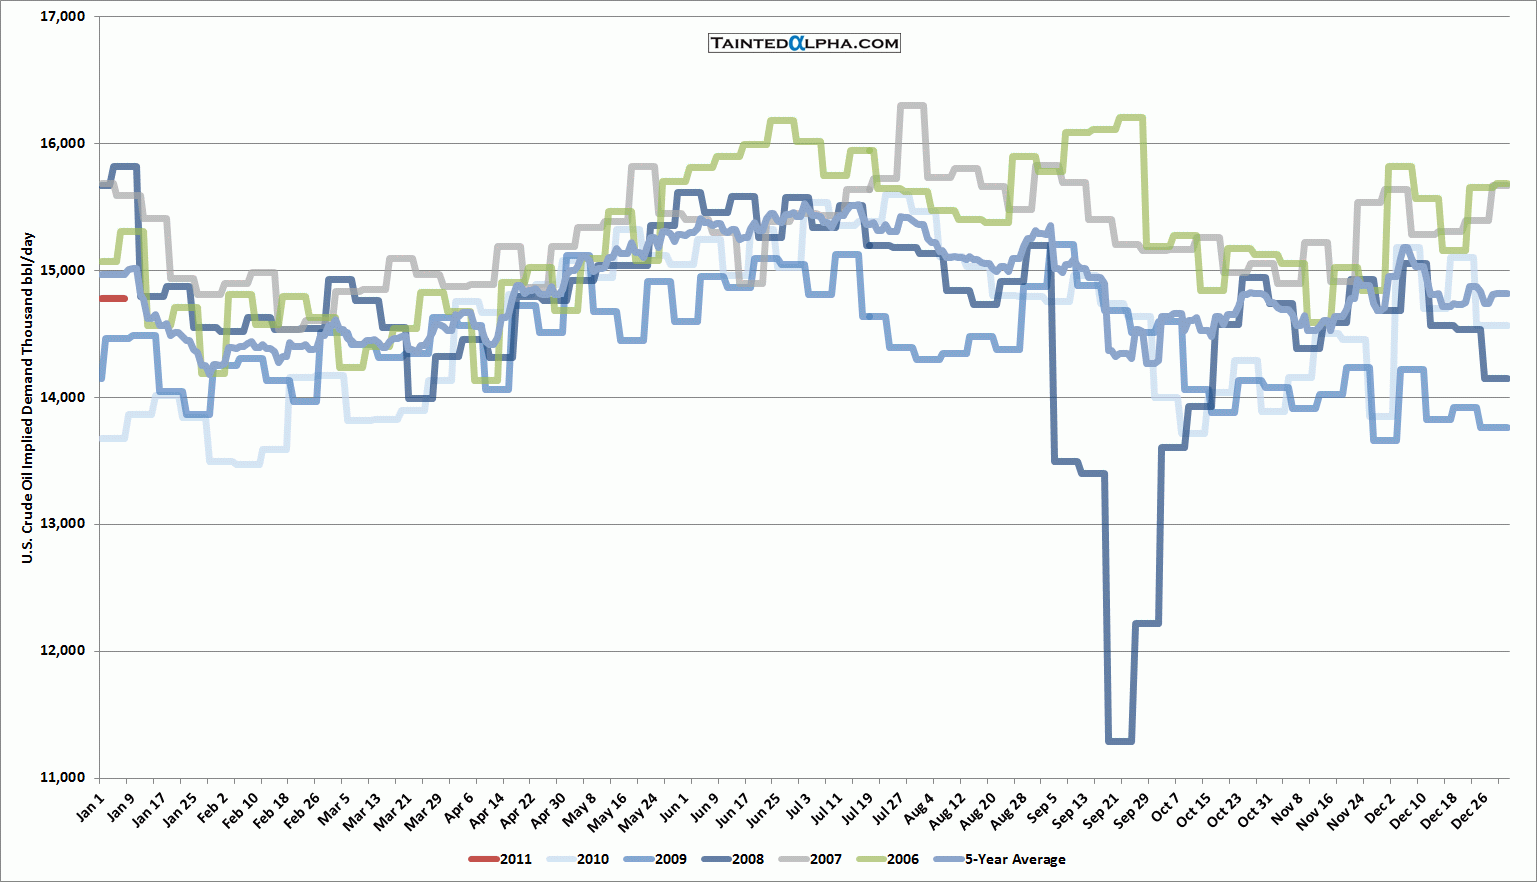
Implied crude oil demand remained unchanged.
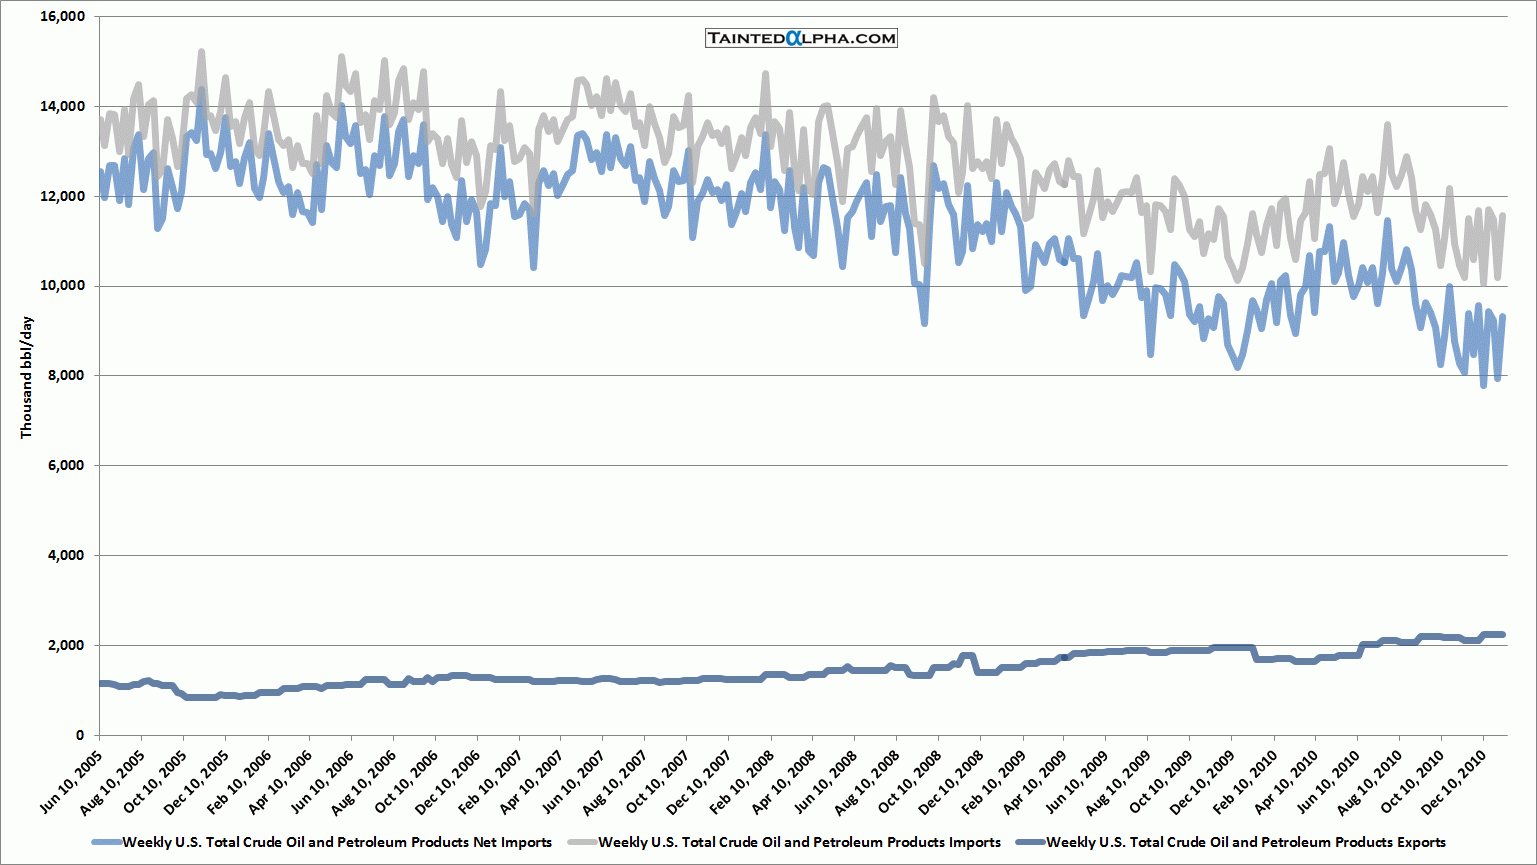
Crude oil and petroleum product net imports rose 1.4 million barrels to 9.3 million barrels.
Large gasoline stockpiling because of bad weather. Going into new year crude oil stocks will probably rise on refiner restocking and not so stellar demand.
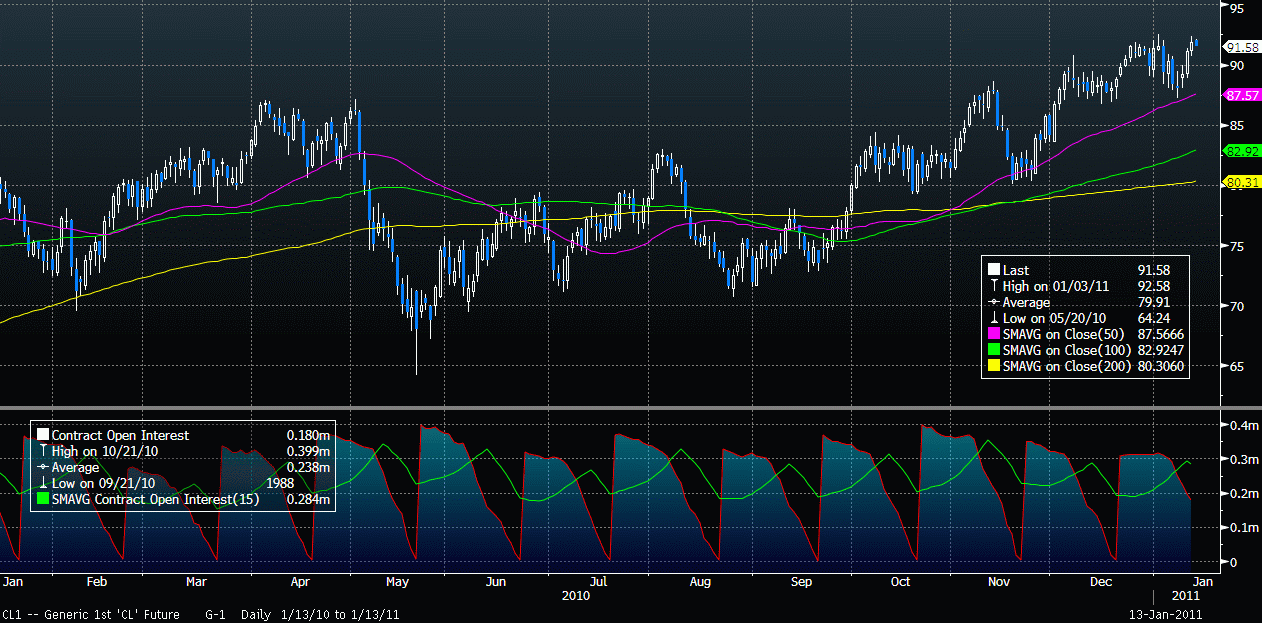
Chart 1. Crude Oil Futures
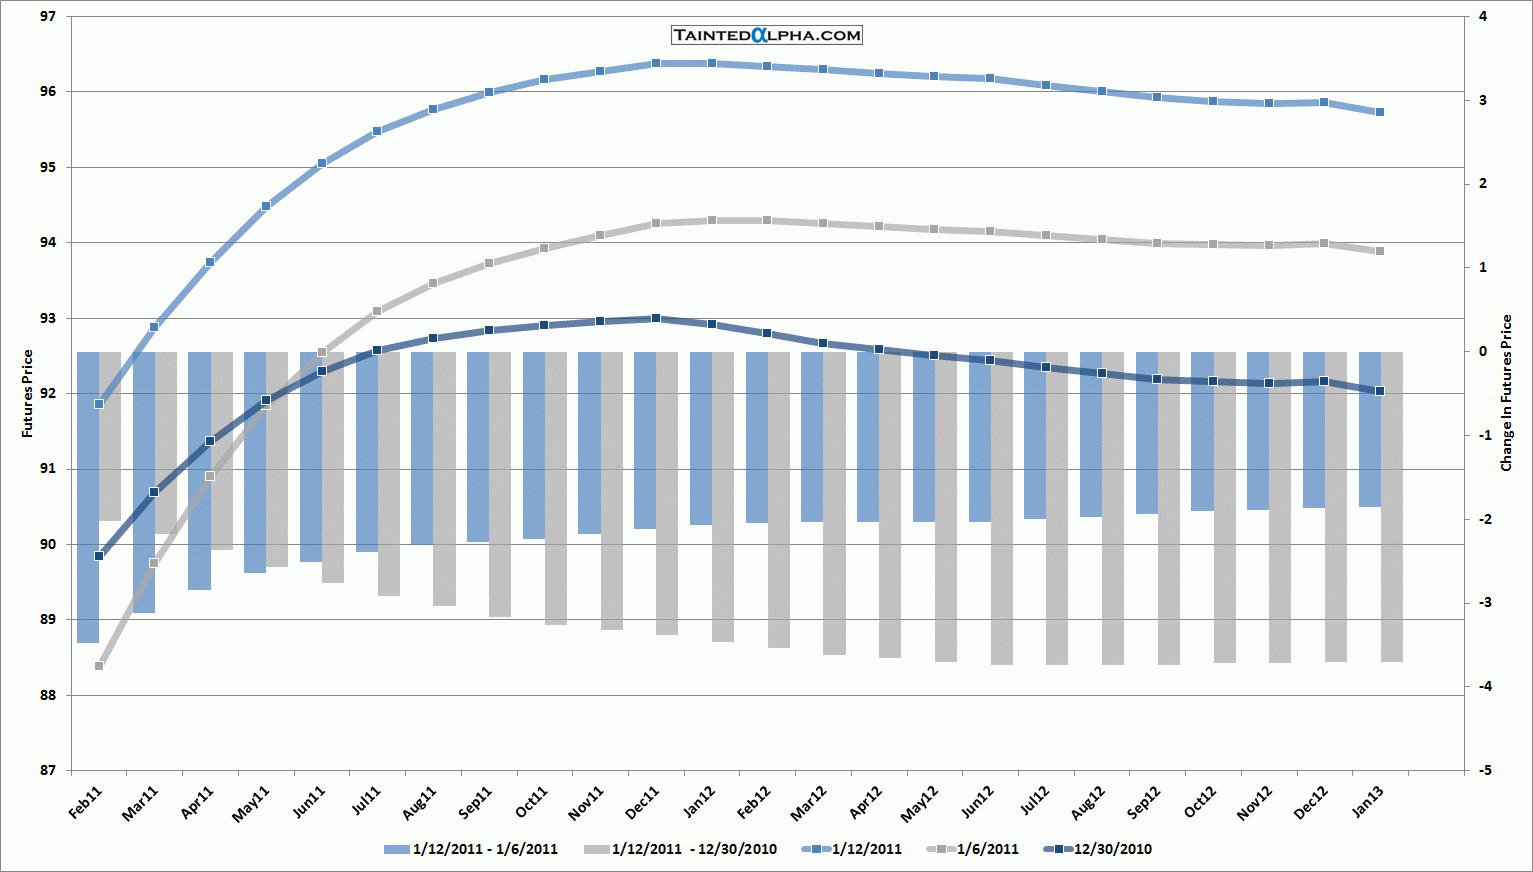
Chart 2. Crude Oil Futures Curve
Chart 3. Weekly Change in U.S. Crude Oil and Distillates Stocks
Chart 4. U.S. Crude Oil Implied Demand
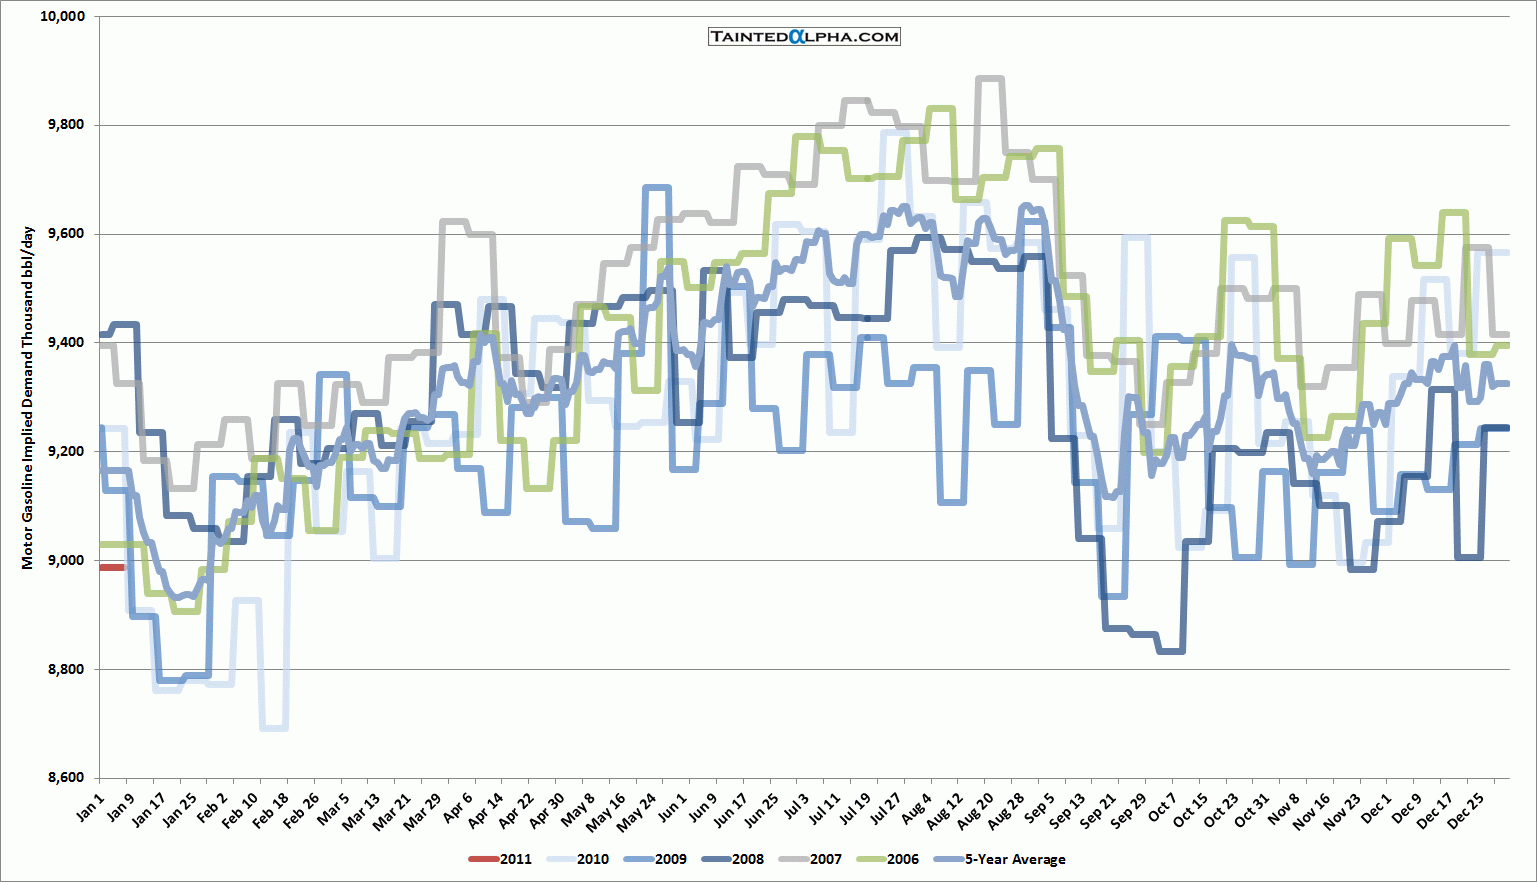
Chart 5. U.S. Motor Gasoline Implied Demand
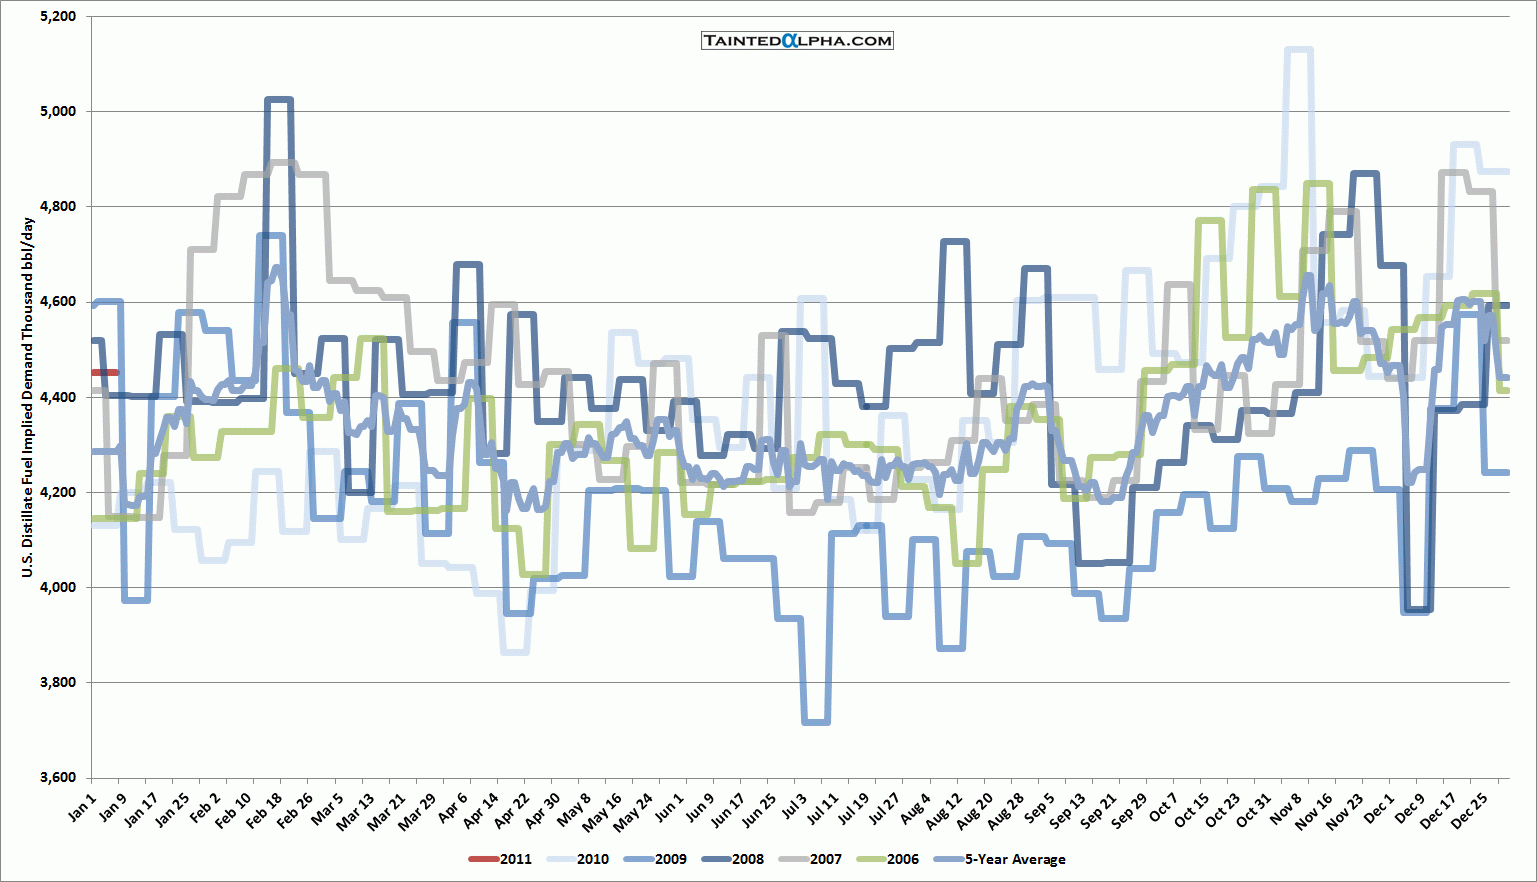
Chart 6. U.S. Distillate Fuel Implied Demand
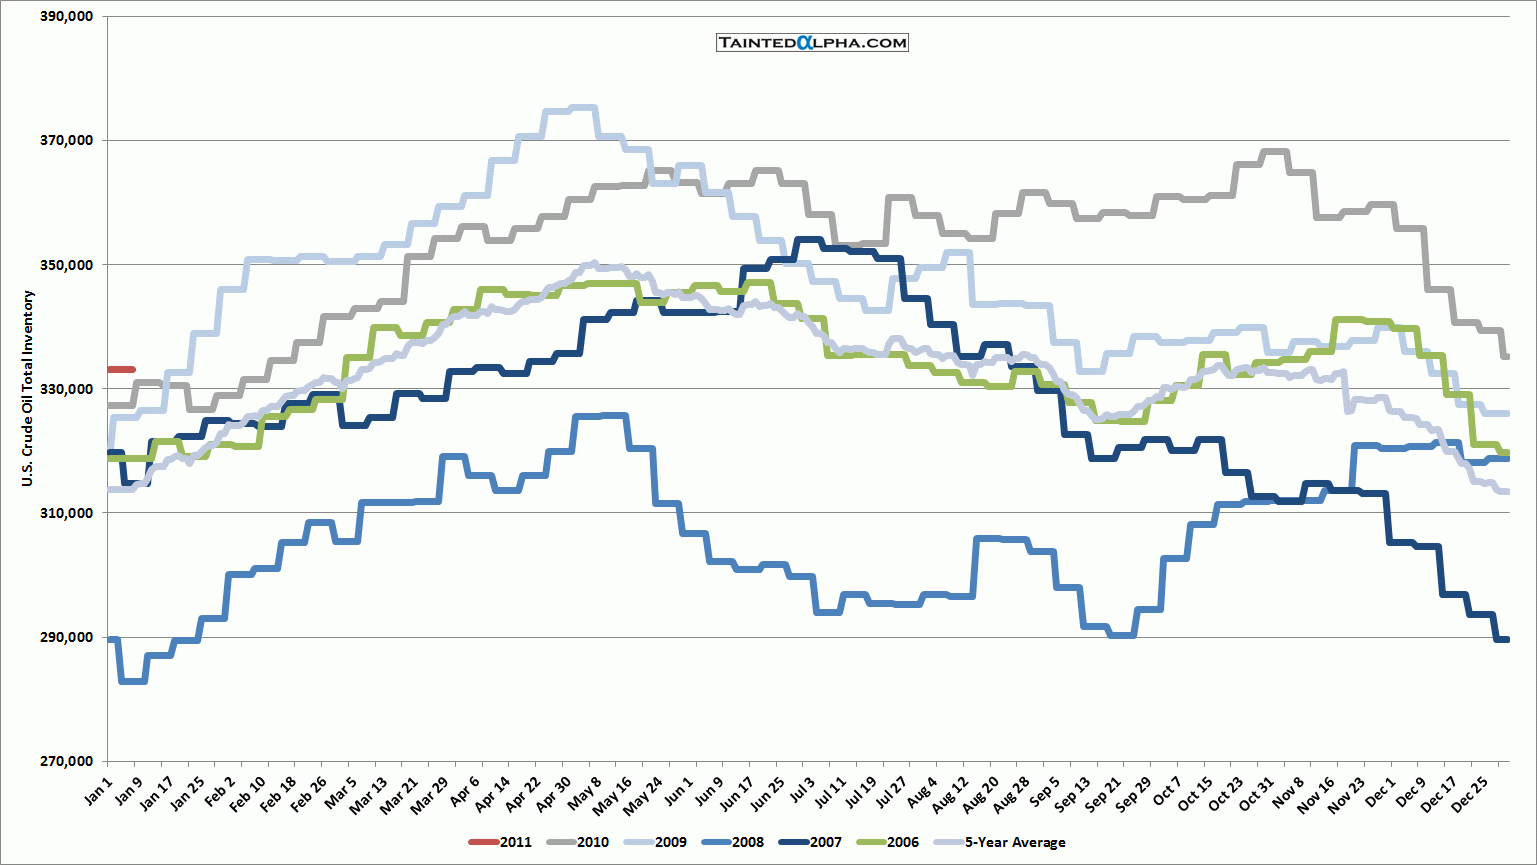
Chart 7. U.S. Crude Oil Total Inventory
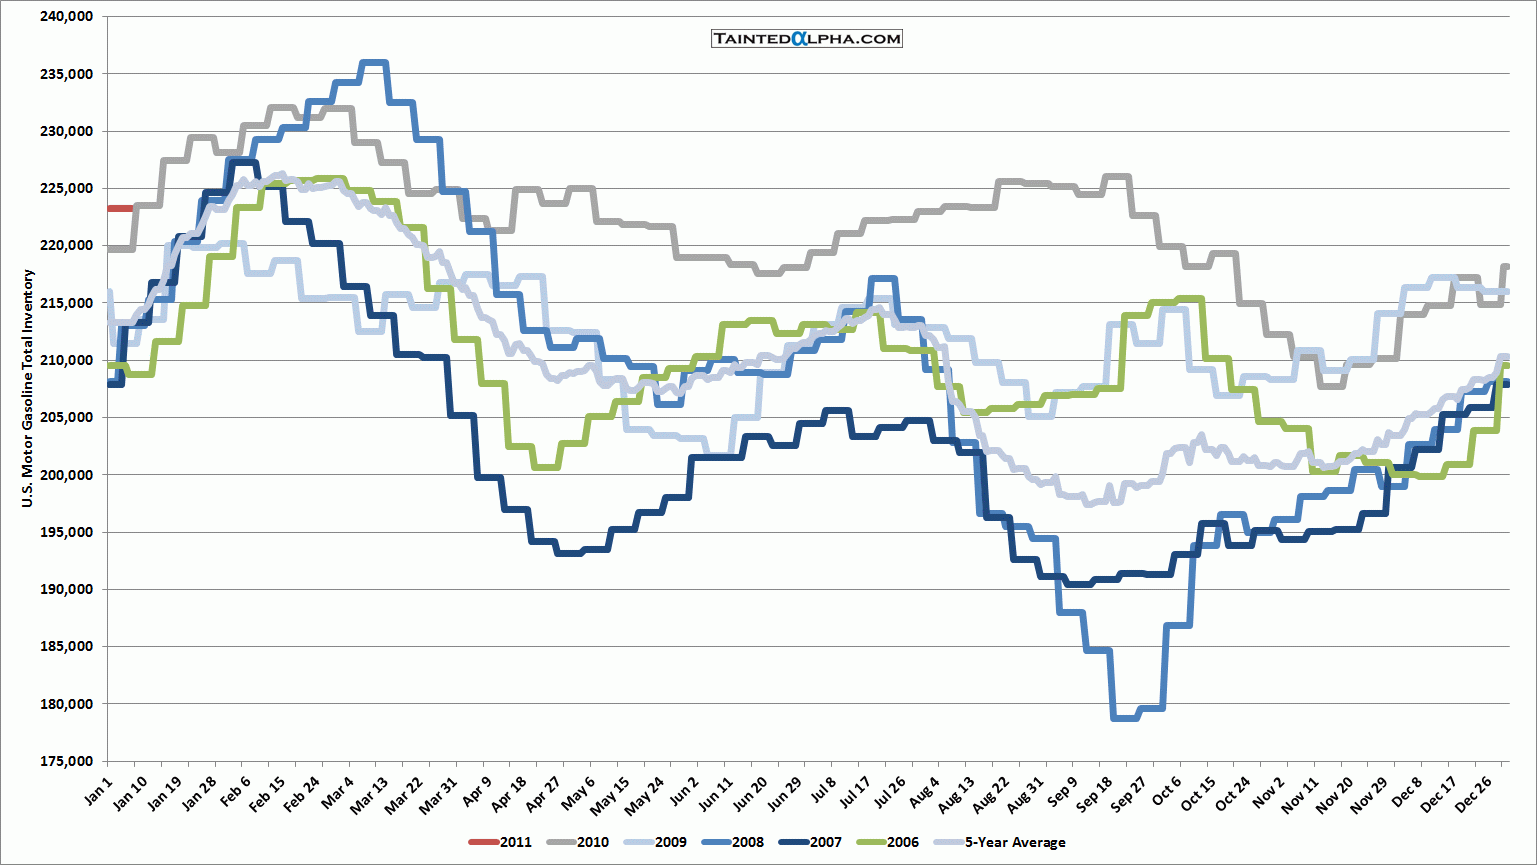
Chart 8. Motor Gasoline Total Inventory
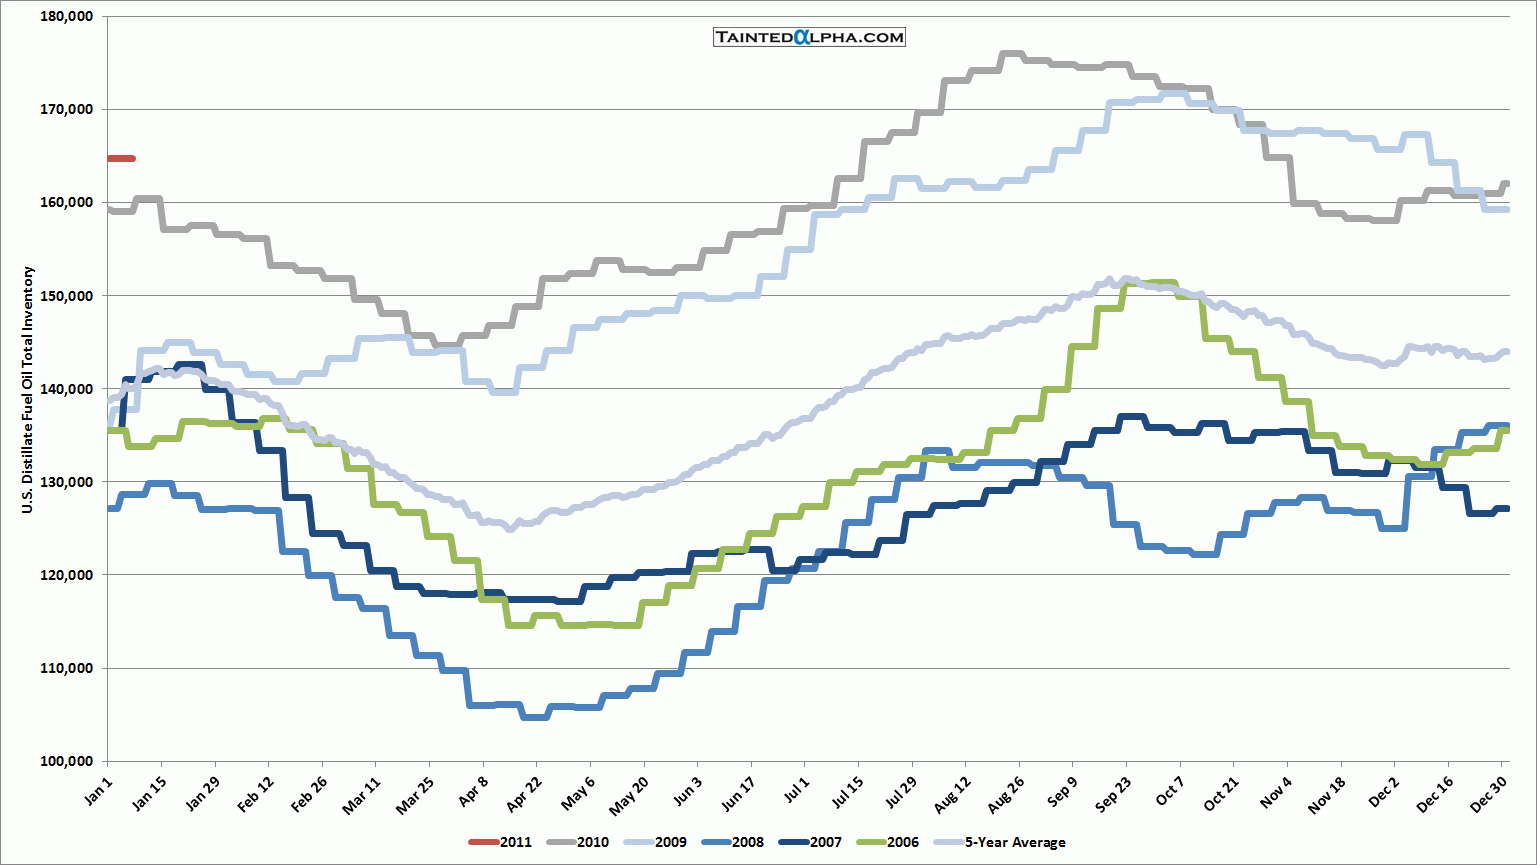
Chart 9. Distillate Fuel Oil Total Inventory
Chart 10. U.S. Refinery Capacity, Inputs, and Production
Chart 11. Weekly U.S. Total Crude Oil and Petroleum Products Imports and Exports
