U.S. Petroleum Weekly – November 4, 2010
(For The Week Ending October 29, 2010)
QE 2 !!!
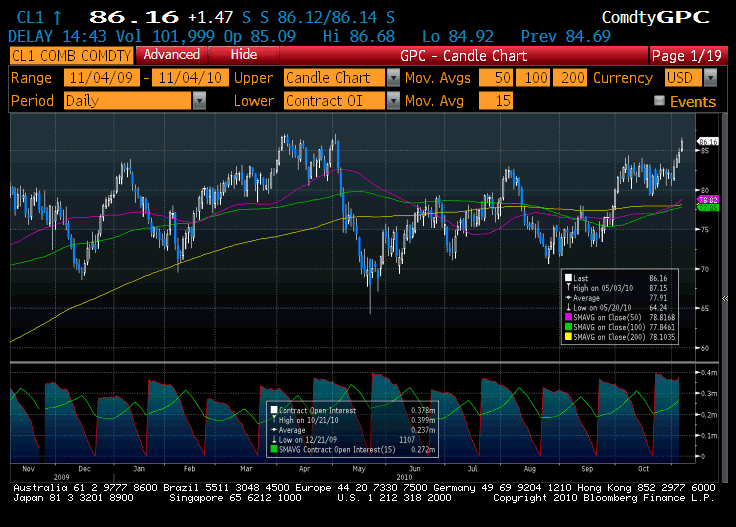
Chart 1. Crude Oil Futures
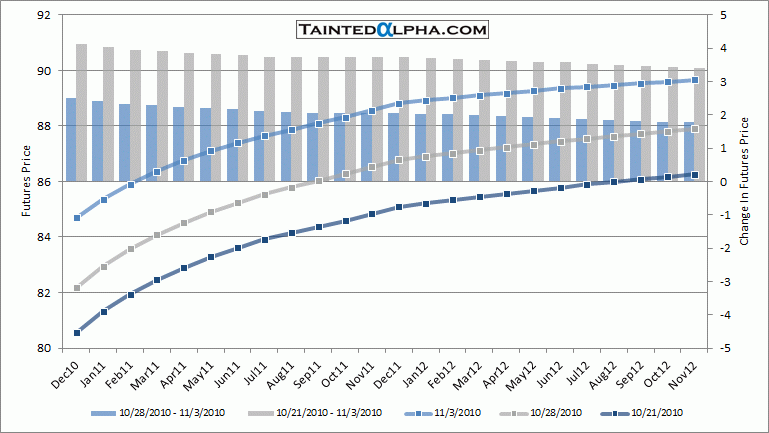
Chart 2. Crude Oil Futures Curve
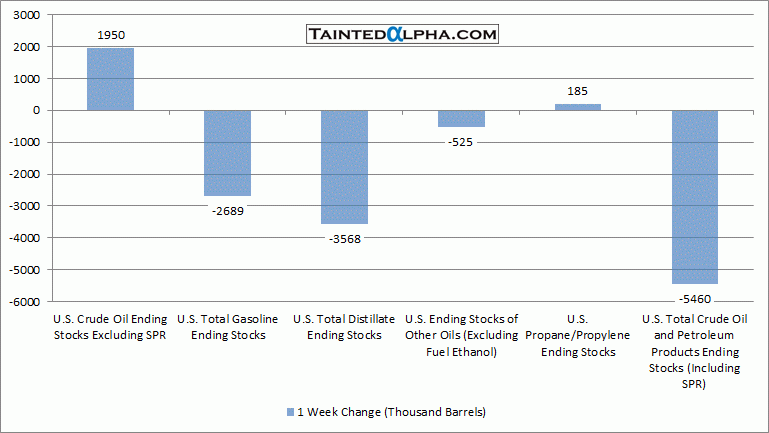
Chart 3. Weekly Change in U.S. Crude Oil and Distillates Stocks
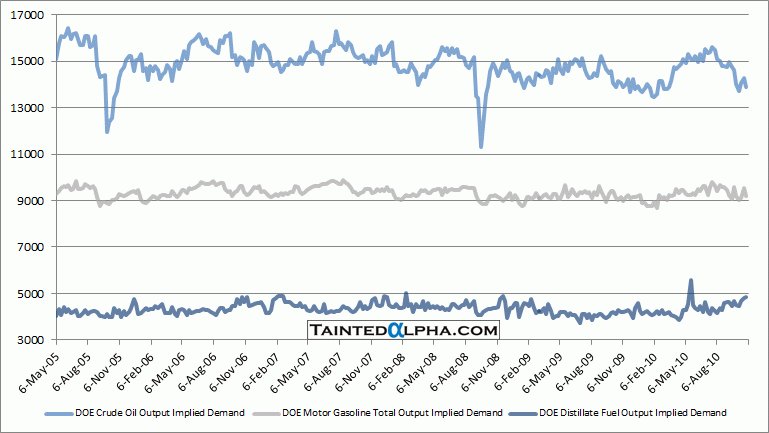
Chart 4. Crude Oil, Gasoline and Distillate Fuel Implied Demand
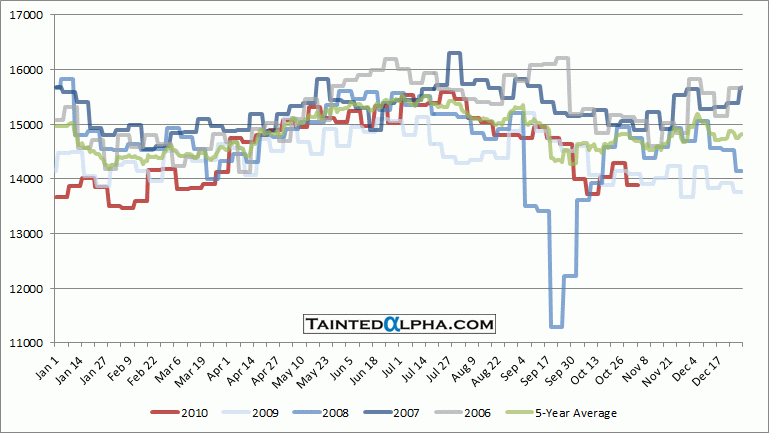
Chart 5. Crude Oil Implied Demand Seasonality
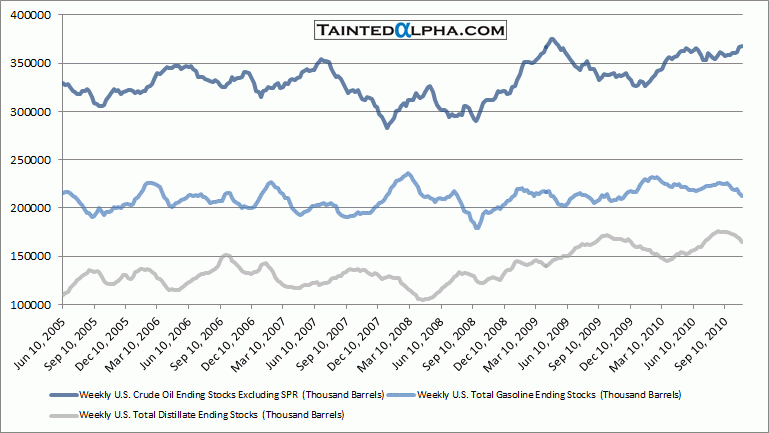
Chart 6. U.S. Total Crude Oil, Gasoline and Distillate Ending Stocks
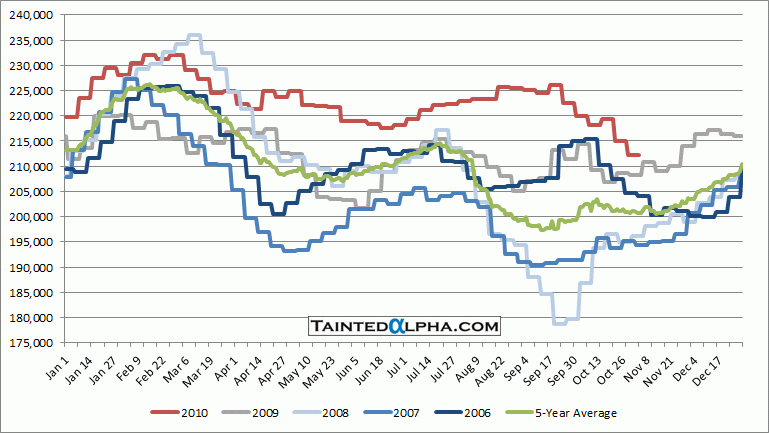
Chart 7. DOE Motor Gasoline Total Inventory Seasonality
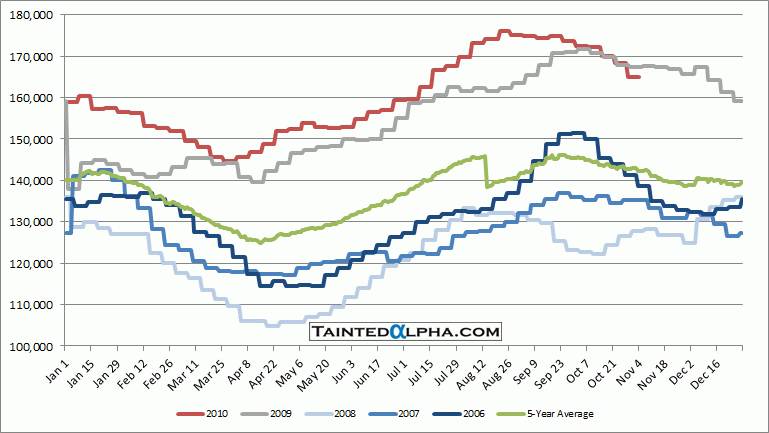
Chart 8. DOE Distillate Fuel Oil Total Inventory Seasonality
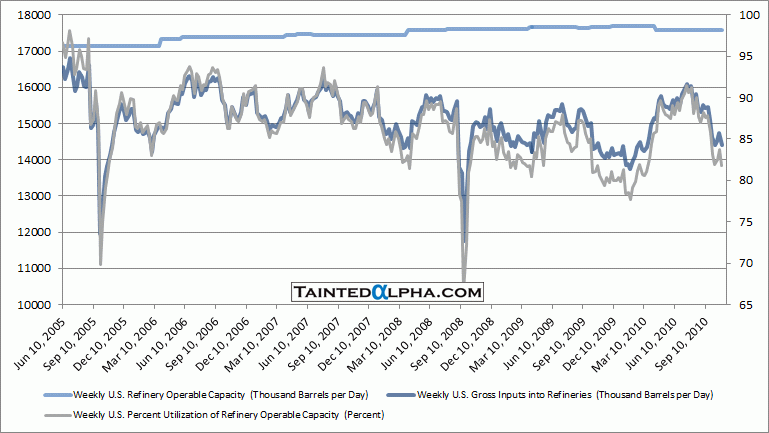
Chart 9. U.S. Refinery Capacity, Inputs, and Production
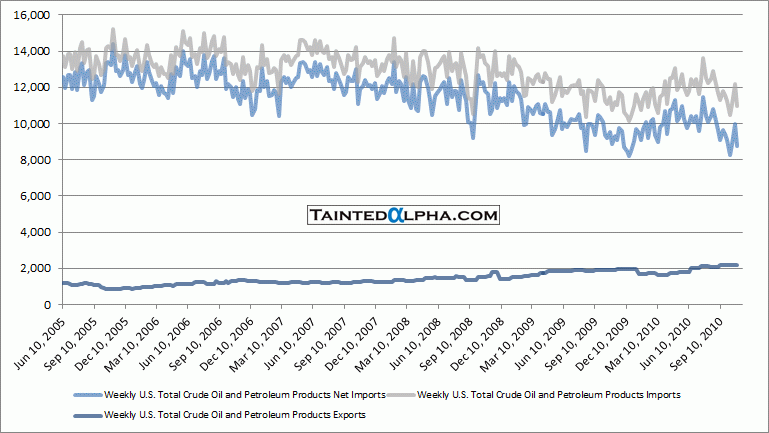
Chart 10. Weekly U.S. Total Crude Oil and Petroleum Products Imports and Exports
