U.S. Petroleum Weekly – September 30, 2010
(For The Week Ending September 24, 2010)
Belisarius had a real bad time compiling this report today, as he is struggling to find purpose in hard work on this piece of analysis and apparent zero usefulness in trading.
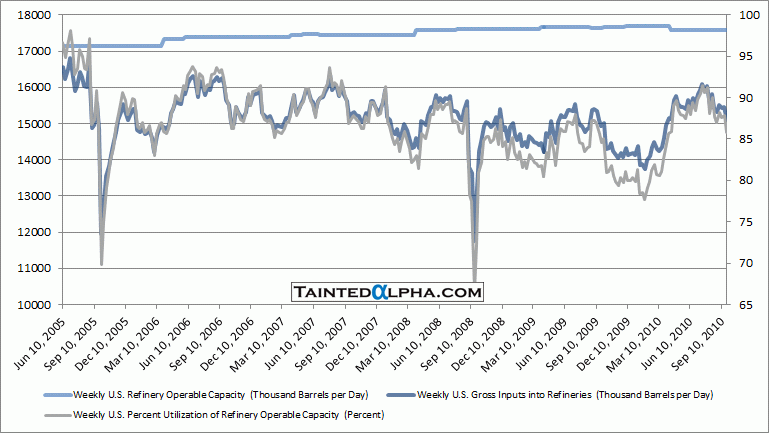
In short refinery utilization collapsed so we had a small gasoline draw, and the price of crude oil skyrocketed on that…
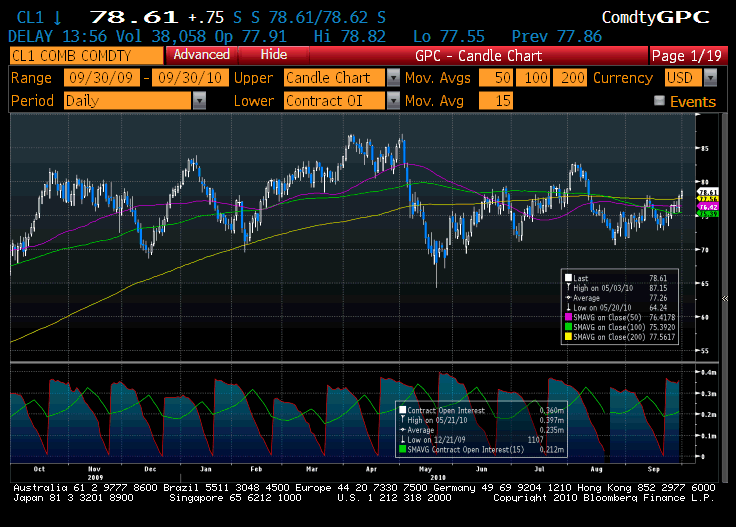
Chart 1. Crude Oil Futures
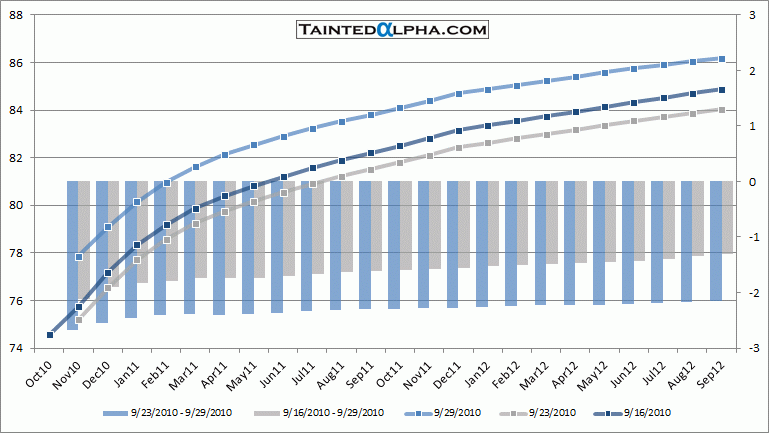
Chart 2. Crude Oil Futures Curve
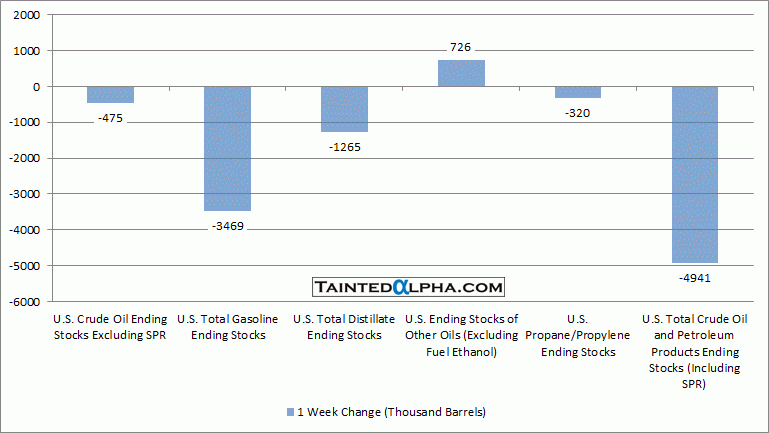
Chart 3. Weekly Change in U.S. Crude Oil and Distillates Stocks
Chart 4. Crude Oil, Gasoline and Distillate Fuel Implied Demand
Chart 5. Crude Oil Implied Demand Seasonality
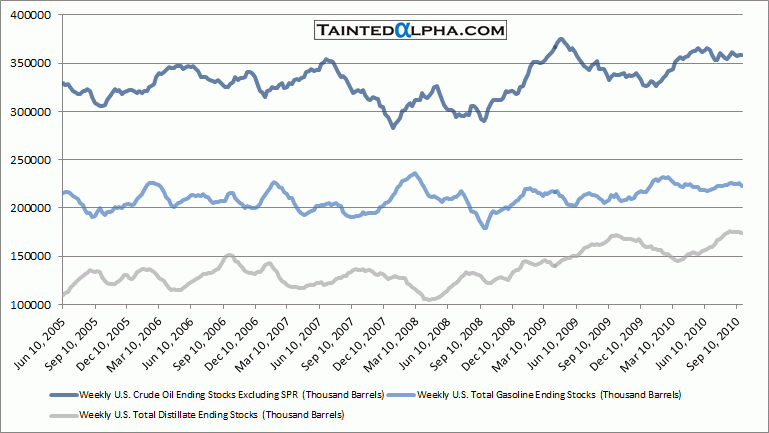
Chart 6. U.S. Total Crude Oil, Gasoline and Distillate Ending Stocks
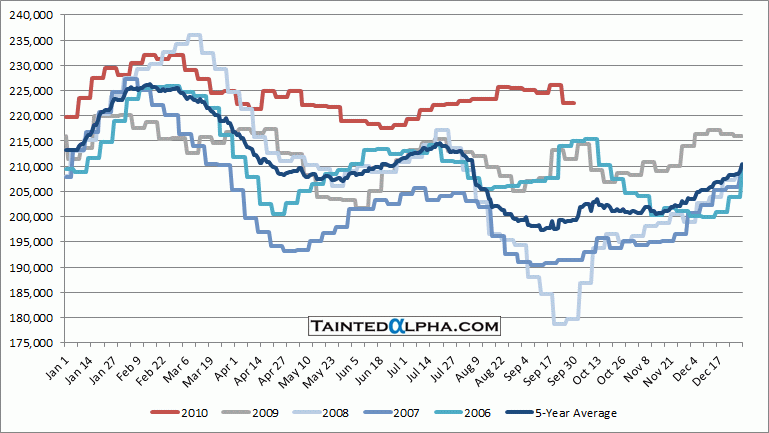
Chart 7. DOE Motor Gasoline Total Inventory Seasonality
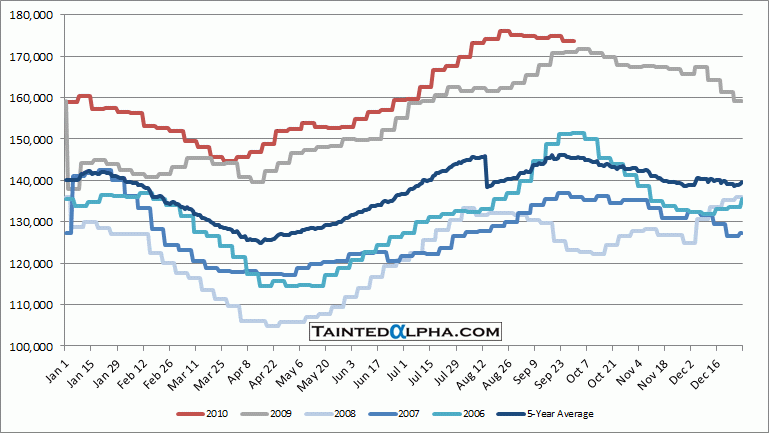
Chart 8. DOE Distillate Fuel Oil Total Inventory Seasonality
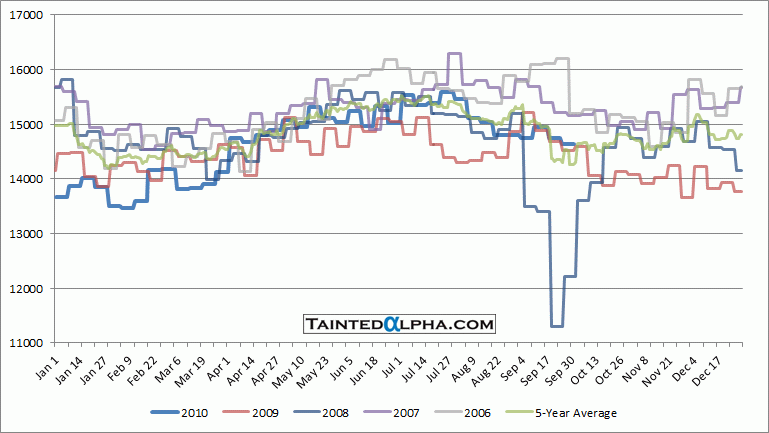
Chart 9. U.S. Refinery Capacity, Inputs, and Production
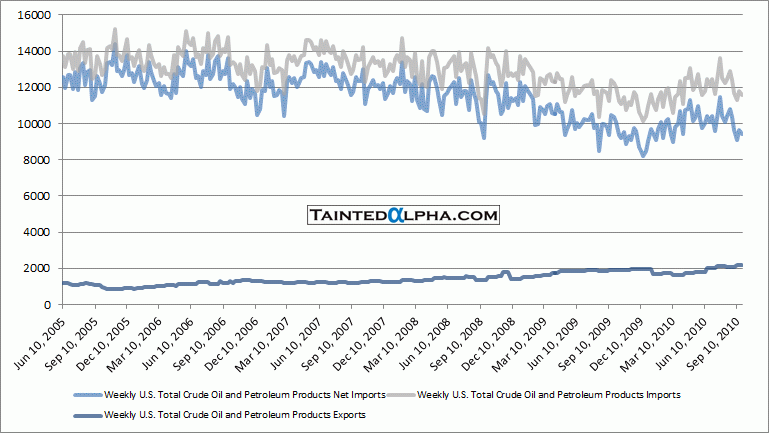
Chart 10. Weekly U.S. Total Crude Oil and Petroleum Products Imports and Exports
