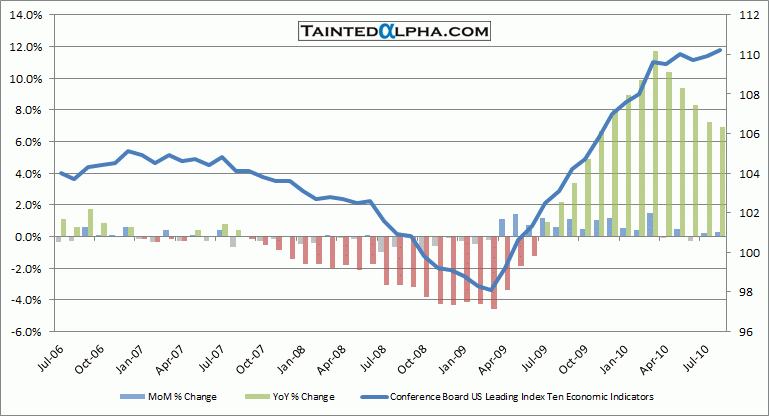
Conference Board Leading Economic Index For August Rose 0.3%
(For August 2010)
If you were (same as I) wondering why market moved up it was because of this.
Conference Board Leading Economic Index (LEI) rose 0.3% in August. The consensus was at 0.1%, prior revised reading was at 0.1%. On year level LEI is up 6.9% vs. 7.2% in July.
Digging little deeper we can find this is uber-Keynesian indicator as 43% of its value is derived from monetary factors (M2 and interest rate spread).
LEI contrary to ECRI Leading Index is pointing to minimal GDP growth.
From the press release:
While the recession officially ended in June 2009, the recent pace of growth has been disappointingly slow, fueling concern that the economic recovery could fade and the U.S. could slide back into recession. However, latest data from the U.S. LEI suggest little change in economic conditions over the next few months. Expect more of the same – a weak economy with little forward momentum through 2010 and early 2011.
Chart 1. Conference Board Leading Economic Index

September 23rd, 2010 at 5:17 pm
“LEI contrary to ECRI Leading Index is pointing to minimal GDP growth.”
Says who? You quote a press release from the Conference Board. Do you have a contrasting quote from ECRI?
September 24th, 2010 at 1:38 am
For LEI, yes from press release.
For ECRI – evident from historical data: every instance the ECRI Weakly Leading Index y-o-y growth fell bellow -10% threshold was followed by negative GDP growth. Yes, I am aware ECRI official comments are not on that path, but I would give some credit to historical data.
October 13th, 2010 at 2:06 pm
Where do I Find this data of historicals? I would like to plot it myself.
October 13th, 2010 at 3:09 pm
I’m not aware that there’s free source of data available; you have to subscribe to either Conference Board or some of the data services that provide (partial) data (Bloomberg, Reuters, Haver Analytics…).