U.S. Petroleum Weekly – September 16, 2010
(For The Week Ending September 10, 2010)
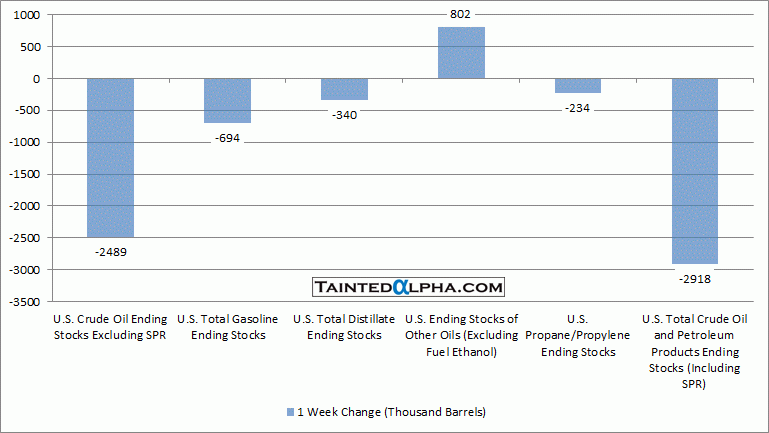
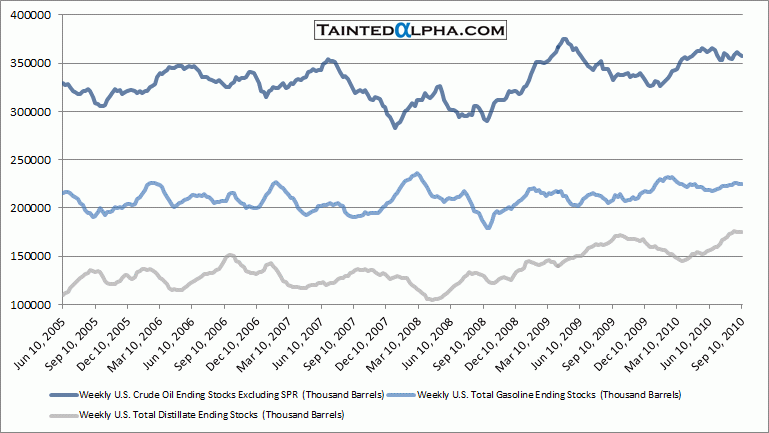
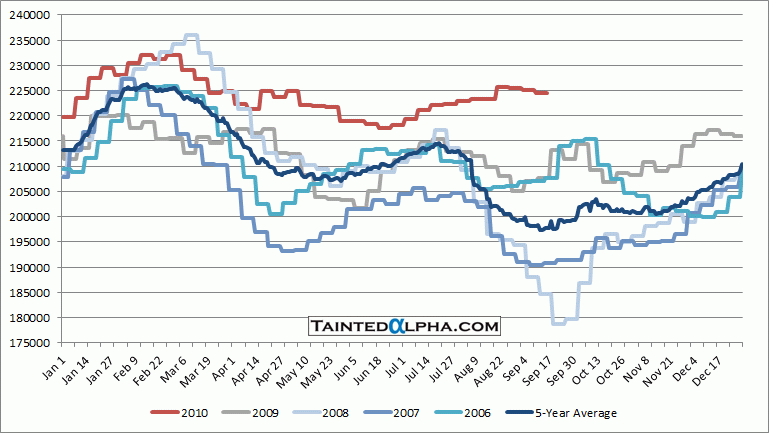
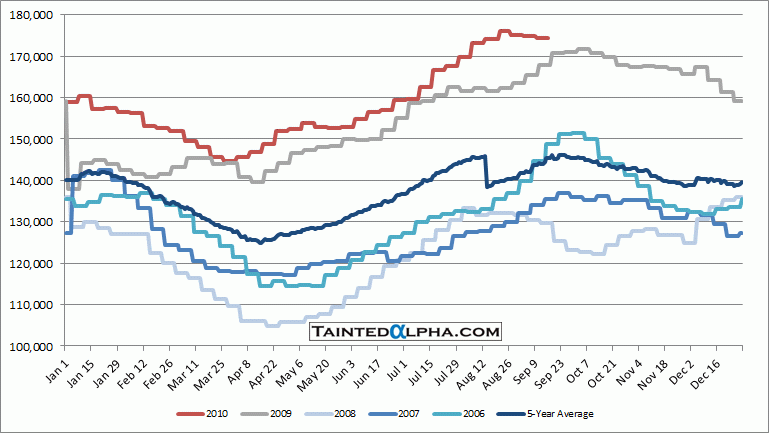
Crude oil stocks fell 1.9 million barrels for the week ending September 10, 2010; Gasoline stocks decreased 0.7 million barrels; Distillate stocks fell 0.3 million barrels; Propane/propylene stocks fell 0.2 million barrels; Other oils stocks were up 0.8 million barrels; Total crude oil and petroleum stocks were 2.9 million barrels lower than the week before.
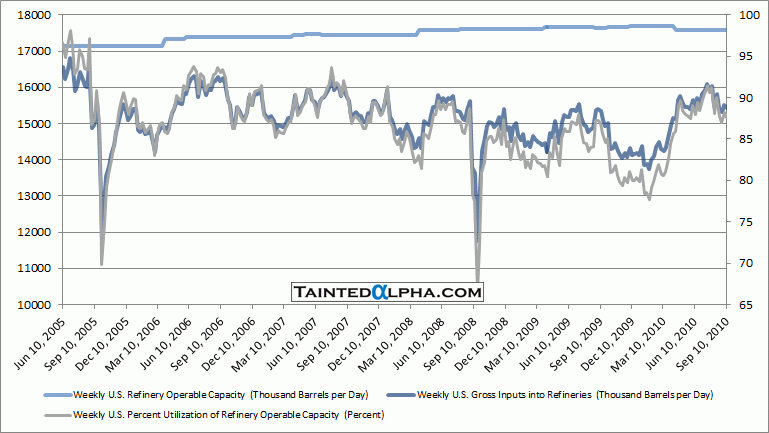
Refinery utilization fell 0.6% to 87.6%.
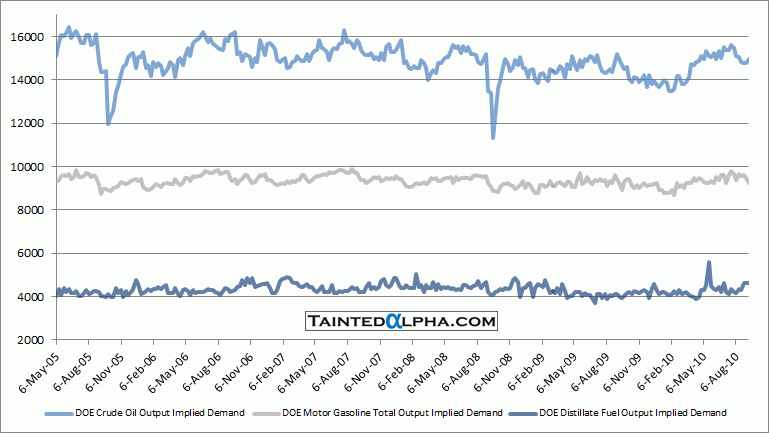
Implied crude oil demand rose 0.2 million barrels.
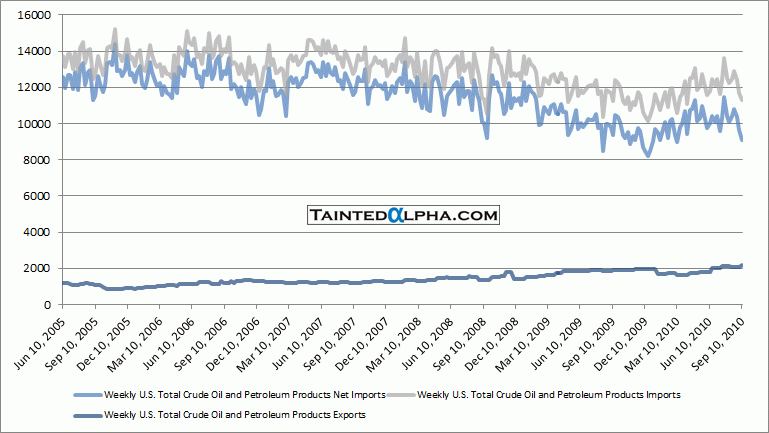
Crude oil and petroleum product net imports fell for 0.5 million barrels to 9.1 million barrels. That tells a lot on future demand.
All categories of petroleum stocks are still at extremely elevated levels. Gasoline and distillate stocks at multi-year highs.
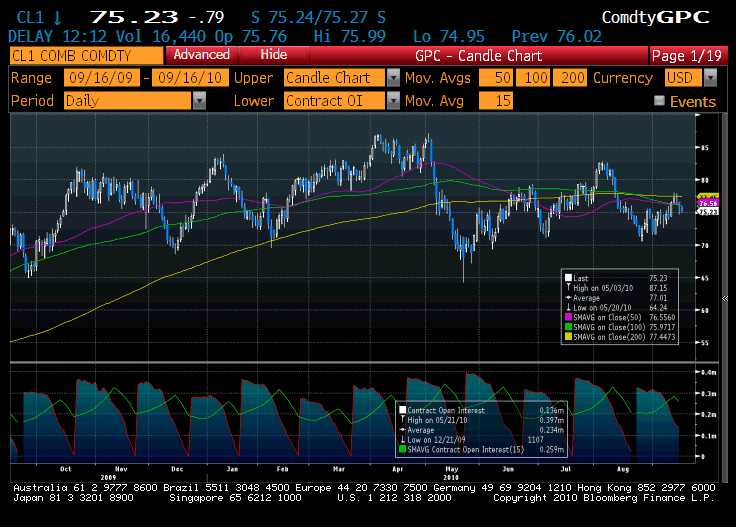
Looks like investment demand puts a floor on price at around 70 dollars…
Chart 1. Crude Oil Futures
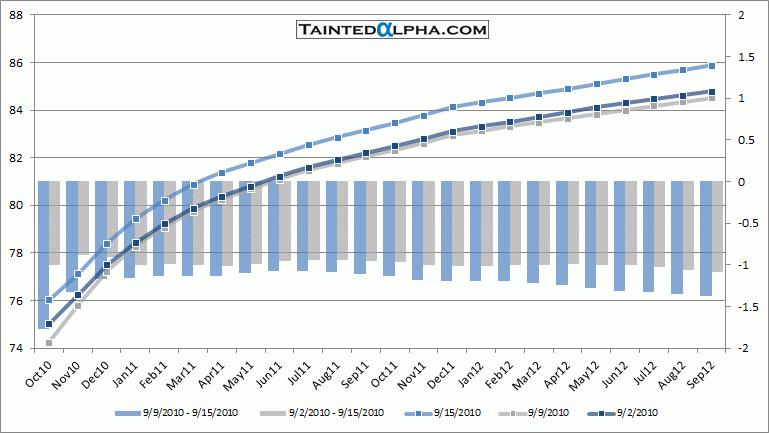
Chart 2. Crude Oil Futures Curve
Chart 3. Weekly Change in U.S. Crude Oil and Distillates Stocks
Chart 4. Crude Oil, Gasoline and Distillate Fuel Implied Demand
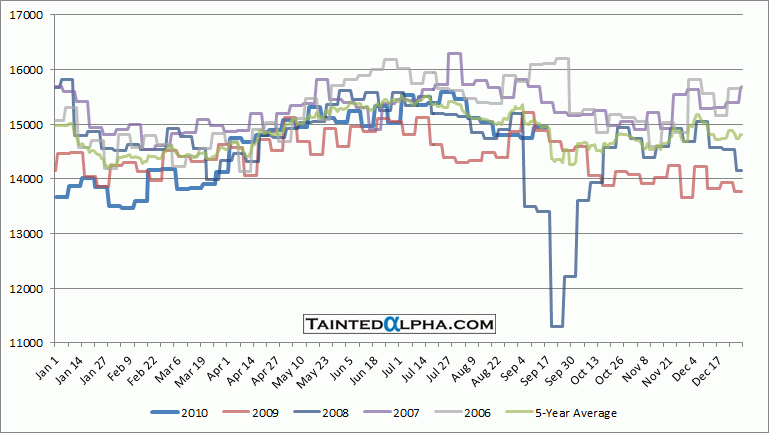
Chart 5. Crude Oil Implied Demand Seasonality
Chart 6. U.S. Total Crude Oil, Gasoline and Distillate Ending Stocks
Chart 7. DOE Motor Gasoline Total Inventory Seasonality
Chart 8. DOE Distillate Fuel Oil Total Inventory Seasonality
Chart 9. U.S. Refinery Capacity, Inputs, and Production
Chart 10. Weekly U.S. Total Crude Oil and Petroleum Products Imports and Exports
