U.S. Petroleum Weekly – July 29, 2010
Crude oil stocks rose 7.3 million barrels for week ending July 16; Gasoline stocks remained unchanged; Distillate stocks increased 0.9 million barrels; Propane/propylene stocks rose 0.5 million barrels; Total crude oil and petroleum stocks were 9.0 million barrels higher than the week before.
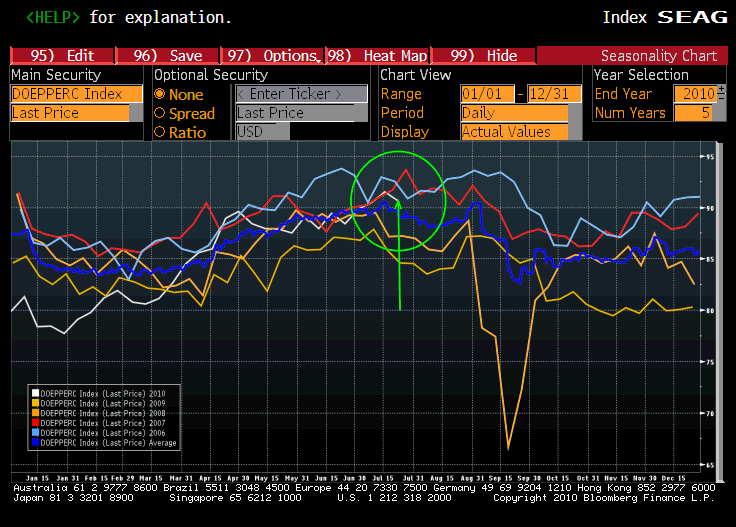
Refinery utilization fell from 91.5% to 90.6%.
Implied crude oil demand was at 15.6 million barrels.
Crude oil and petroleum product net imports rose to 11.4 million barrels.
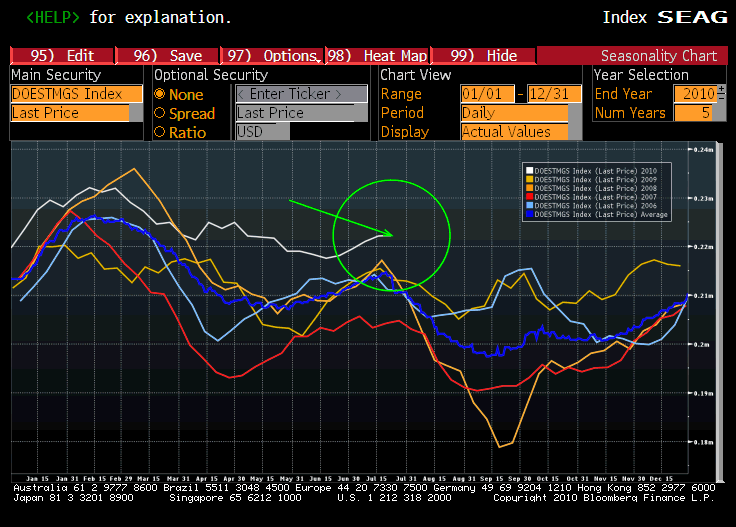
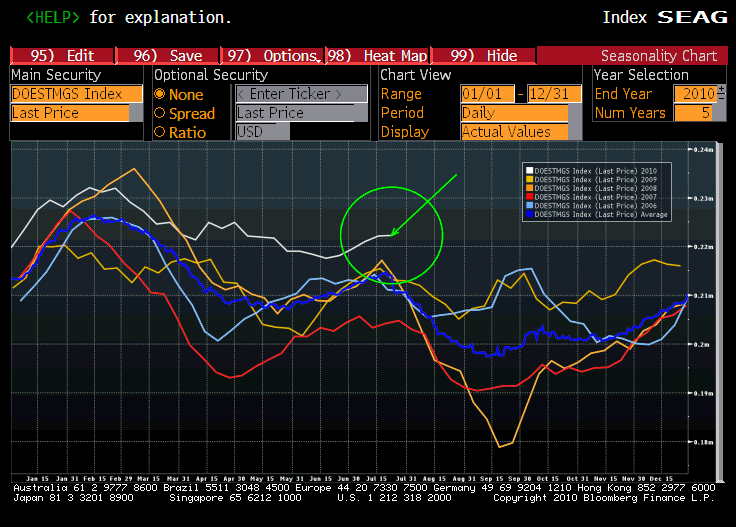
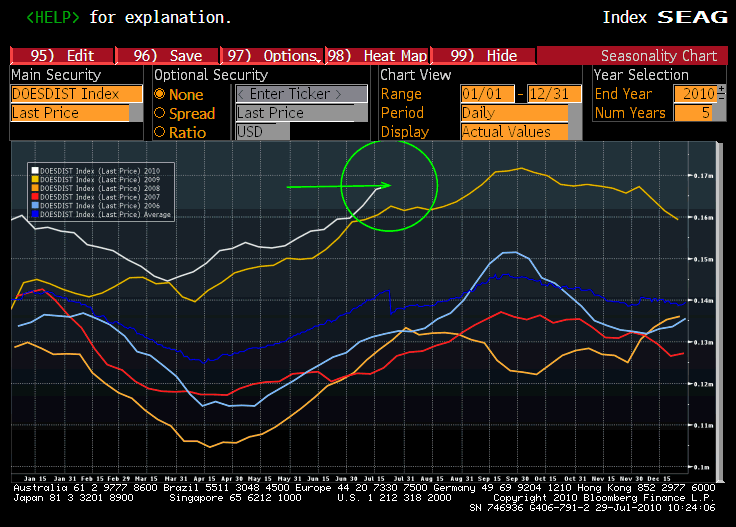
All categories of petroleum stocks are at extremely elevated levels. Highest in last 5 years for this time of the year.
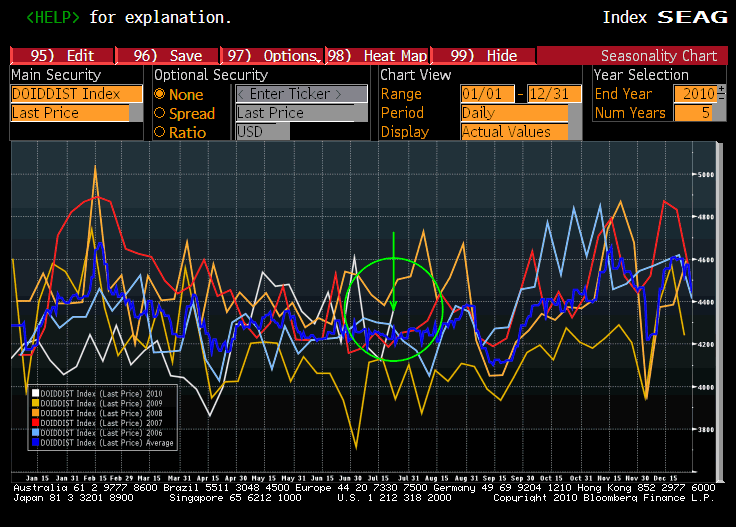
I posted implied demand graphs the market is concentrating. It’s calculated as a change in inventory!!! It’s product supplied directly to inventory, it’s not demand.
It’s cash-and-carry trade and unusual correlation with stocks thats keeping price this high. Full blown bubble.
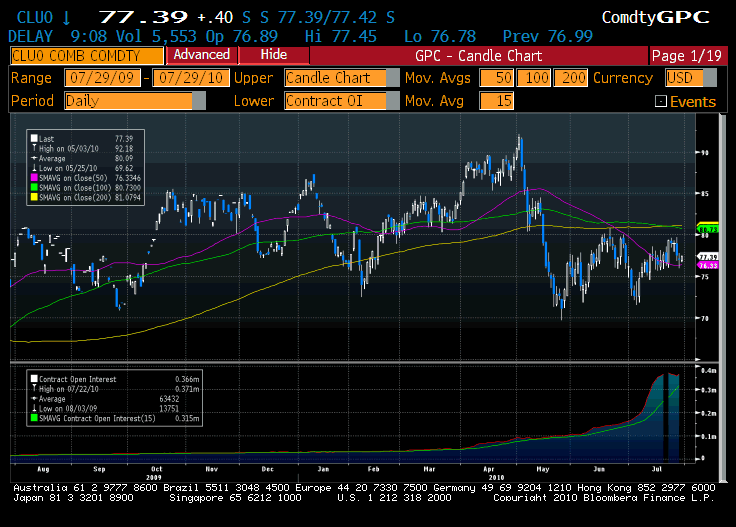
Chart 1. Crude Oil Futures
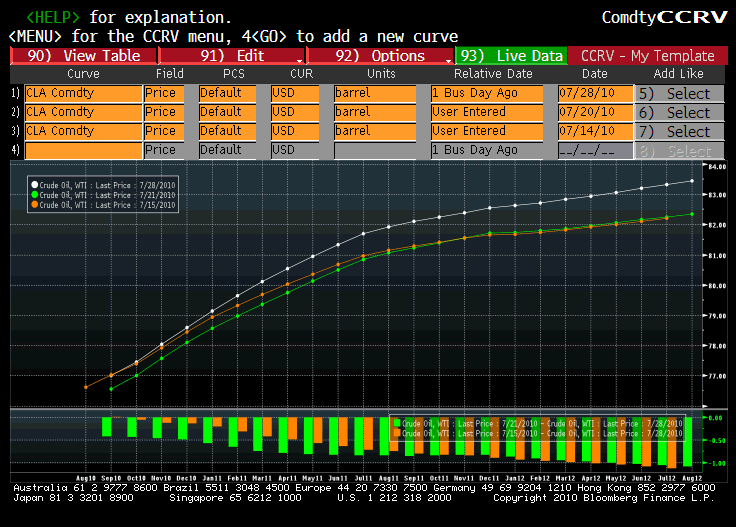
Chart 2. Crude Oil Futures Curve
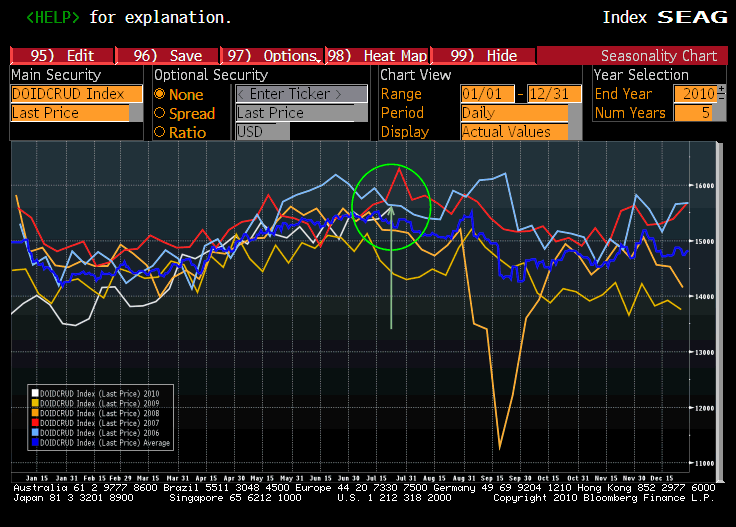
Chart 3. DOE Crude Oil Output Implied Demand
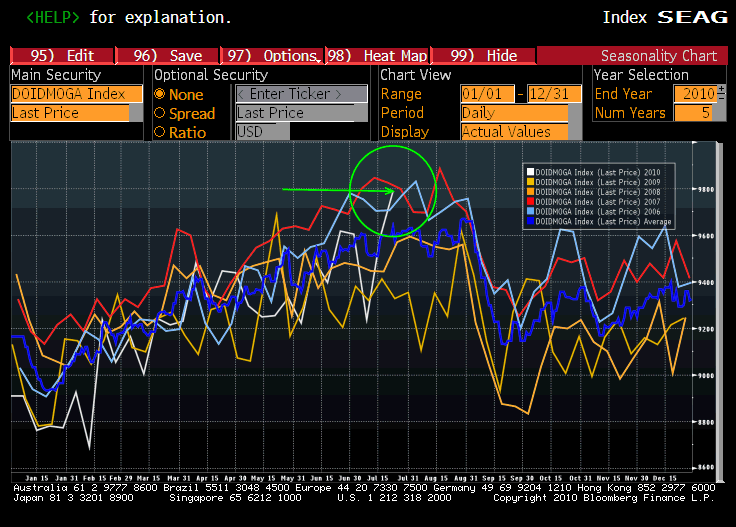
Chart 4. DOE Motor Gasoline Total Output Implied Demand
Chart 5. DOE Distillate Fuel Output Implied Demand Data
Chart 6. DOE Crude Oil Total Inventory Data (excluding Strategic Petroleum Reserve)
Chart 7. DOE Motor Gasoline Total InventoryData
Chart 8. DOE Distillate Fuel Oil Total Inventory Data
Chart 9. DOE Percent Utilization Refinery Operable Capacity
