U.S. Petroleum Weekly – July 22, 2010
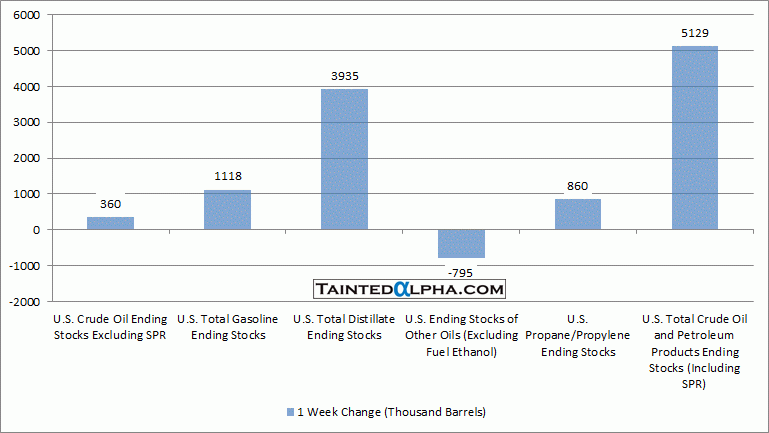
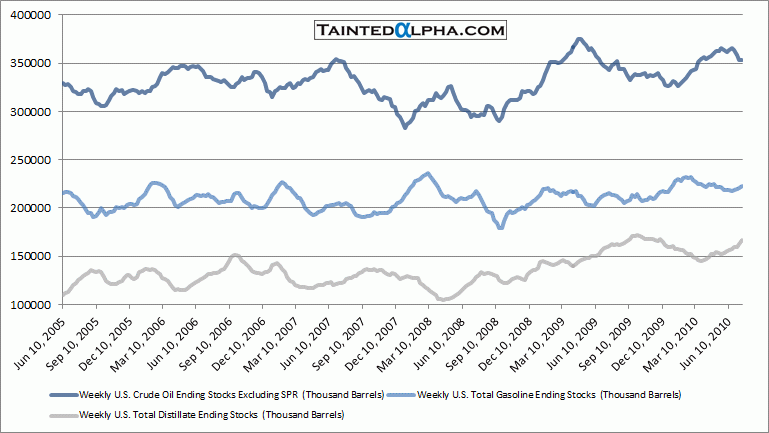
Crude oil stocks rose 0.4 million barrels for week ending July 16; Gasoline stocks rose 1.1 million barrels; Distillate stocks increased 3.9 million barrels; Propane/propylene stocks rose 0.9 million barrels; Total crude oil and petroleum stocks were 5.1 million barrels higher than the week before.
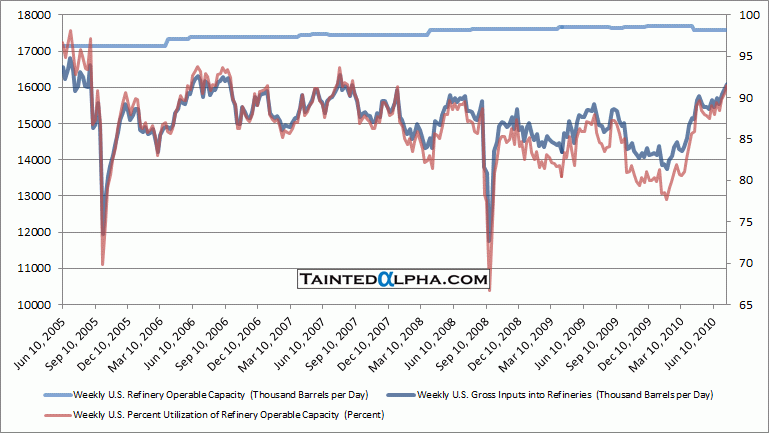
Refinery utilization rose from 90.5% to 91.5%. Highest since August 2007.
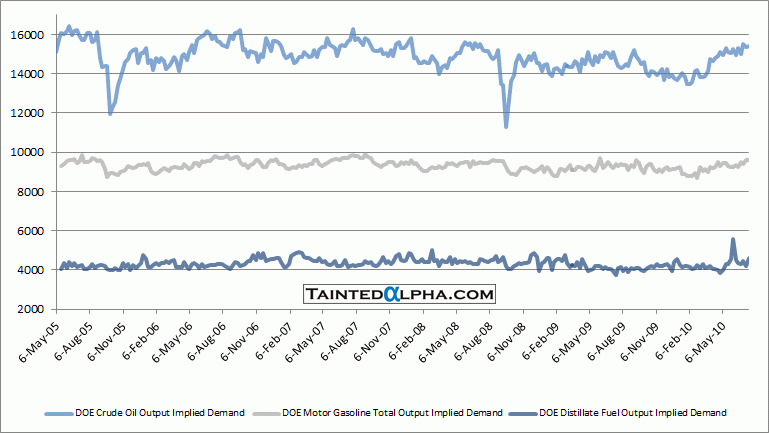
Implied crude oil demand was at 15.4 million barrels.
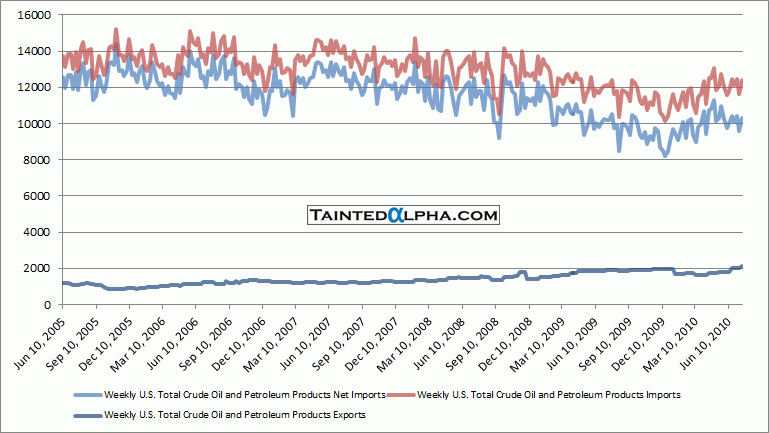
Crude oil and petroleum product net imports rose to 10.3 million barrels. All categories of petroleum stocks are still at extremely elevated levels.
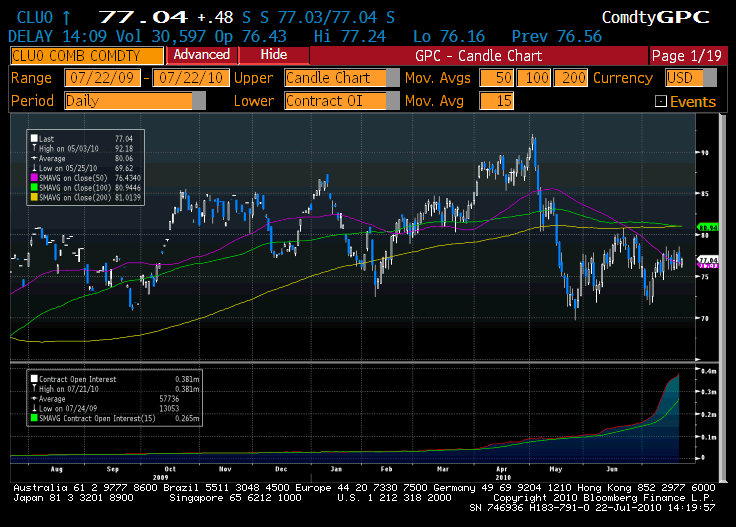
Chart 1. Crude Oil Futures
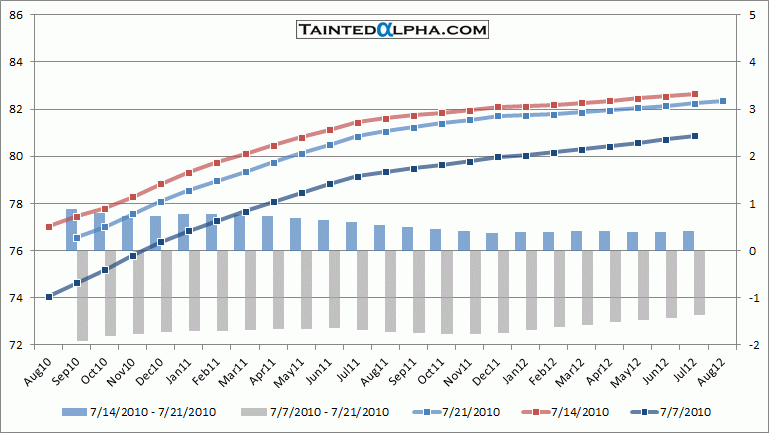
Chart 2. Crude Oil Futures Curve
Chart 3. Weekly Change in U.S. Crude Oil and Distillates Stocks
Chart 4. Crude Oil, Gasoline and Distillate Fuel Implied Demand
Chart 5. U.S. Total Crude Oil, Gasoline and Distillate Ending Stocks
Chart 6. U.S. Refinery Capacity, Inputs, and Production
Chart 7. Weekly U.S. Total Crude Oil and Petroleum Products Imports and Exports
