July 19th, 2010 by Belisarius
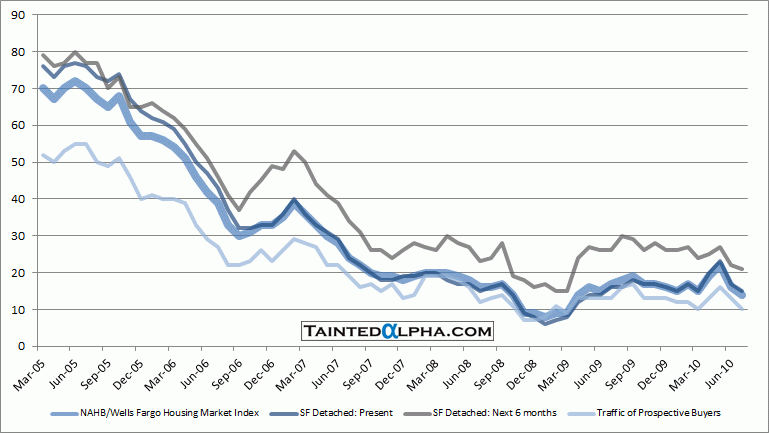
HMI for July came out at 14 vs. downward revised 16 in June. All components were down, most notably traffic of perspective buyers hit 10 vs. 13 in June.
Chart 1. NAHB / Wells Fargo Housing Market Index

Source: NAHB/ Wells Fargo HMI
NAHB/Wells Fargo Housing Market Index
This entry was posted
on Monday, July 19th, 2010 at 8:14 am and is filed under U.S. Housing.
You can follow any responses to this entry through the RSS 2.0 feed.
Both comments and pings are currently closed.
