U.S. Natural Gas Weekly – 20 May 2010
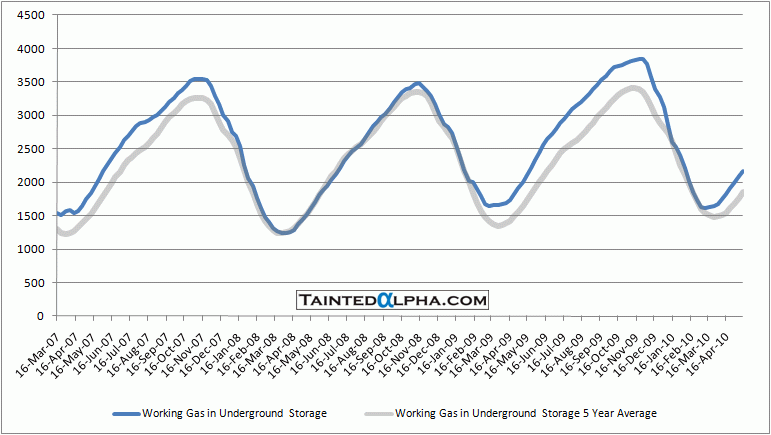
Working gas in storage rose 76 Bcf from previous week. Some signs of increased power generation demand arised, interesting times, maybe a entry point developing.
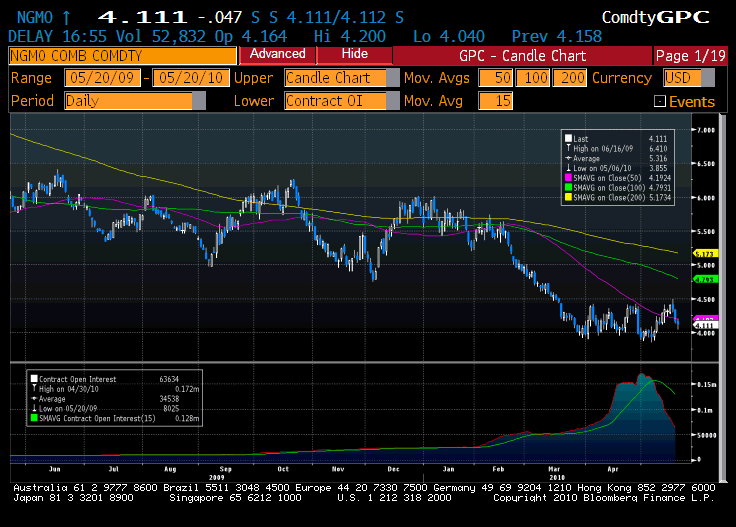
Chart 1. Natural Gas Futures
Chart 2. Working Gas in Underground Storage Compared with 5 Year Average
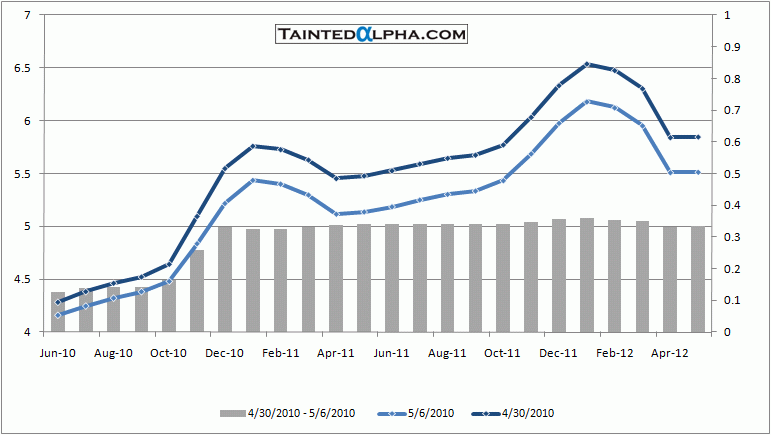
Chart 3. Natural Gas Futures Curve


