U.S. Petroleum Weekly – May 13, 2010
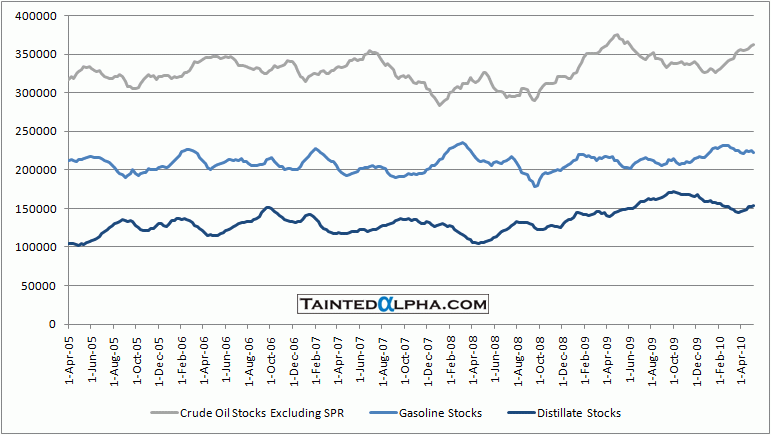
Crude oil stocks rose 1.9 million barrels for week ending May 7; Gasoline stocks fell 2.8 million barrels; Distillate stocks increased 1.4 million barrels; Propane/propylene stocks rose 2.8 million barrels; Other oils stocks were up 1.9 million barrels; Total crude oil and petroleum stocks were 3.4 million barrels higher than the week before.
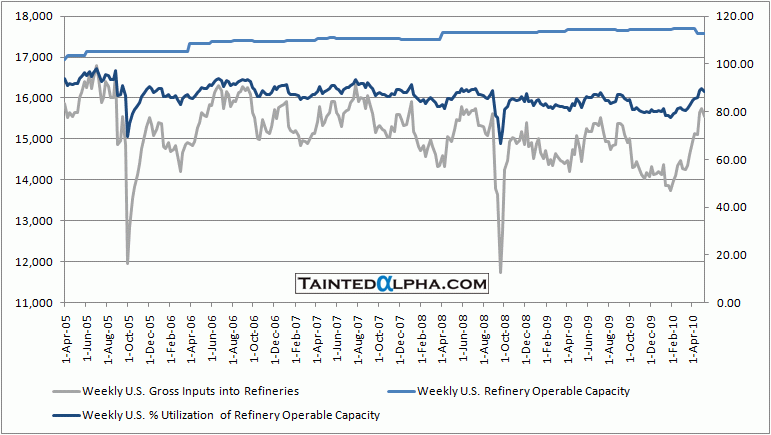
Refinery utilization fell from 89.6% to 88.4%.
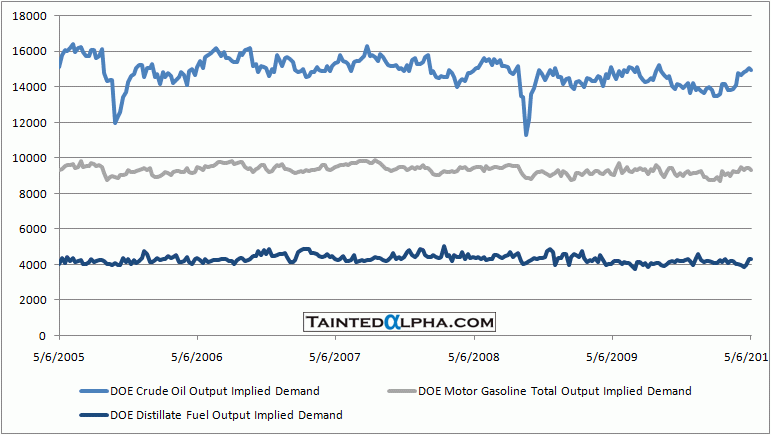
New addition to the graphs is implied demand. It’s hard to dispute that demand has risen a bit, but the disproportion between implied demand and stocks increase is huge.
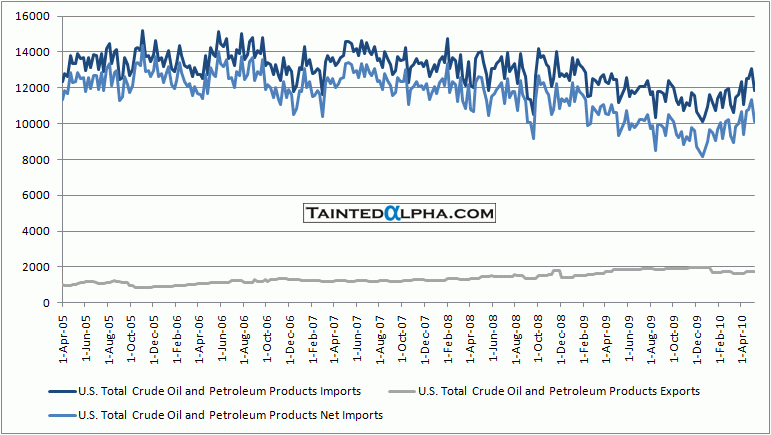
Crude oil and petroleum product net imports were fell to 10.1 million barrels. All categories of petroleum stocks are still at extremely elevated levels.
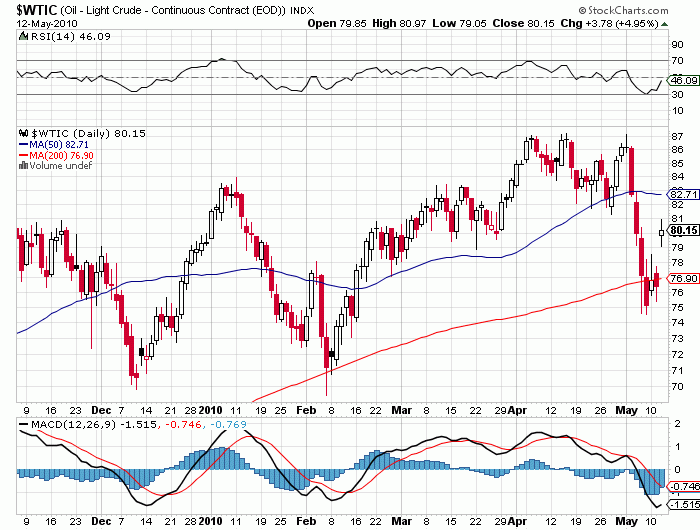
Despite the complete disconnect between crude oil price & fundamentals it would not be pragmatic to expect a further price decline. I would speculate on some price rebound.
Chart 1. Crude Oil Futures
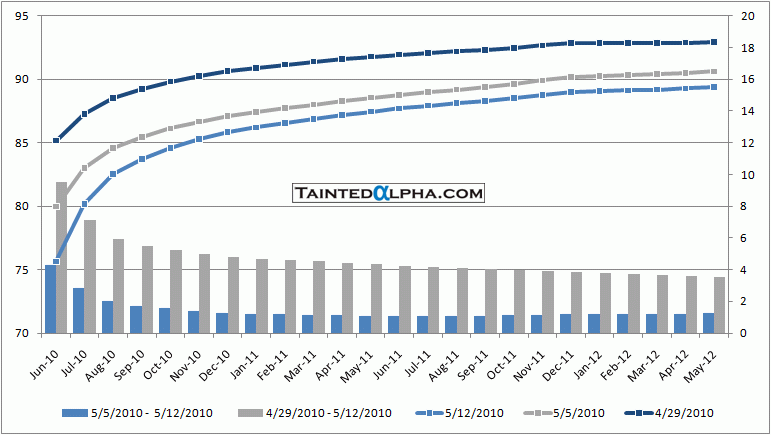
Chart 2. Crude Oil Futures Curve
Chart 3. Weekly Change in U.S. Crude Oil and Distillates Stocks
Chart 5. Crude Oil, Gasoline and Distillate Fuel Implied Demand
Chart 6. U.S. Total Crude Oil, Gasoline and Distillate Ending Stocks
Chart 7. U.S. Refinery Capacity, Inputs, and Production
Chart 8. Weekly U.S. Total Crude Oil and Petroleum Products Imports and Exports
