April 29th, 2010 by Belisarius
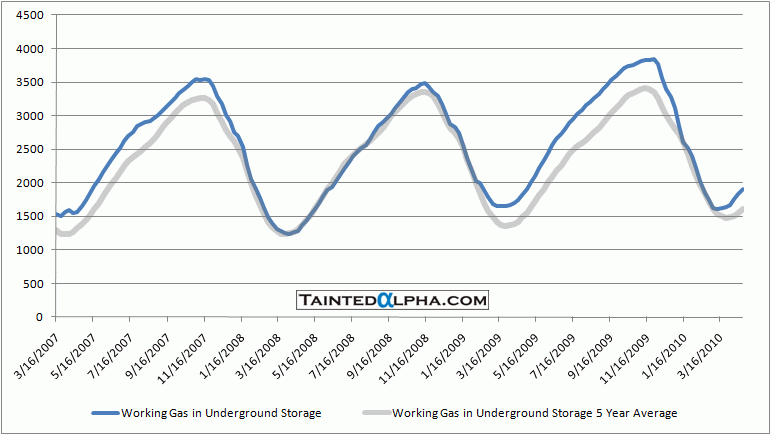
Working gas in storage rose 83 Bcf from previous week. The pain is not coming to its end.
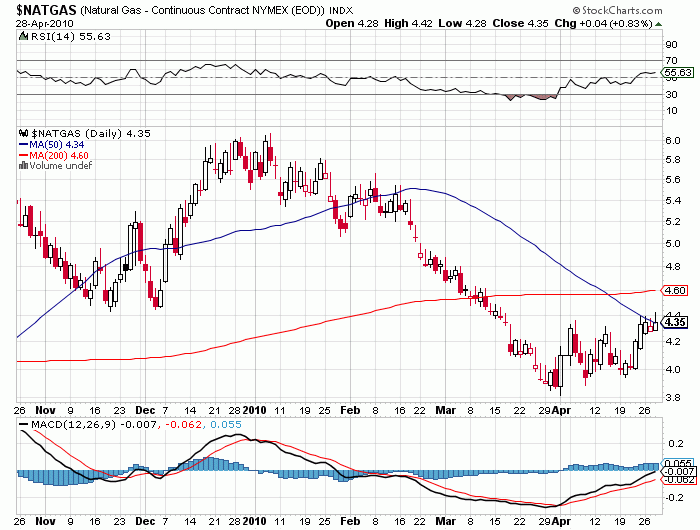
Chart 1. Natural Gas Futures

Source: StockCharts.com
Chart 2. Working Gas in Underground Storage Compared with 5 Year Average

Source: EIA
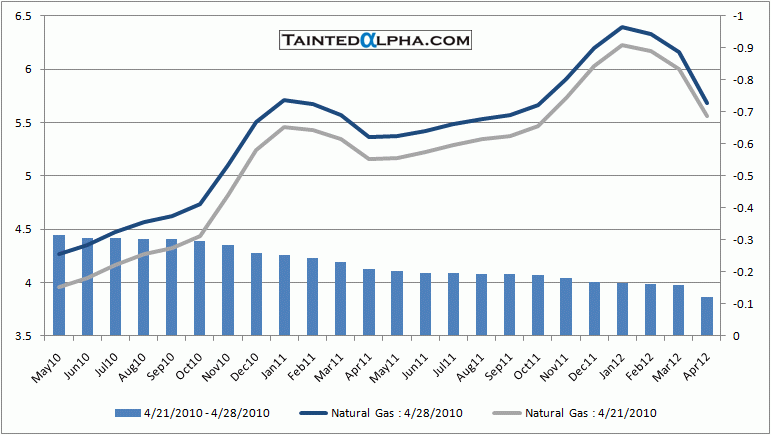
Chart 3. Natural Gas Futures Curve

Source: Bloomberg
Natural Gas
This entry was posted
on Thursday, April 29th, 2010 at 9:16 am and is filed under Commodities, U.S. Natural Gas Weekly.
You can follow any responses to this entry through the RSS 2.0 feed.
Both comments and pings are currently closed.


