U.S. Petroleum Weekly – 18 November 2009
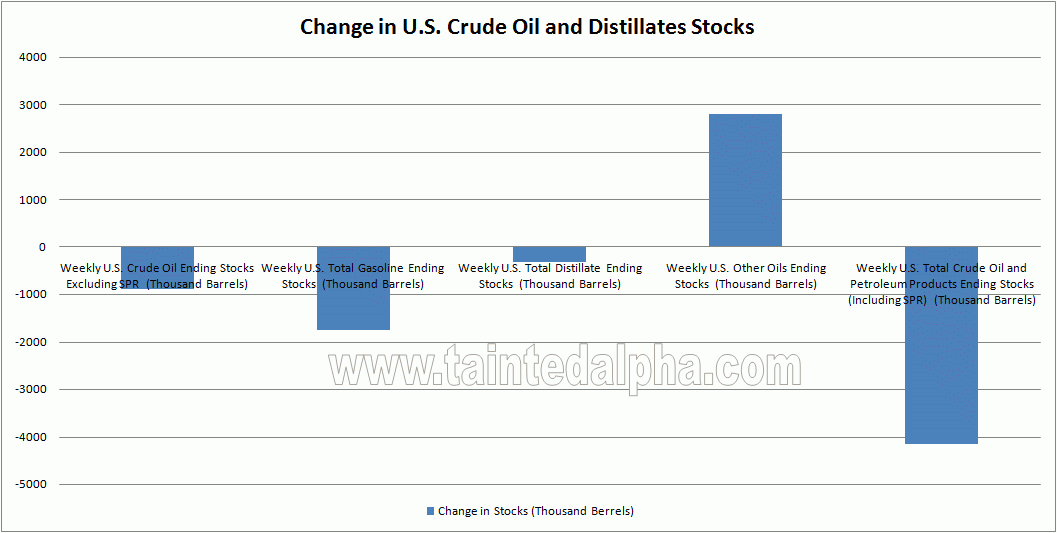
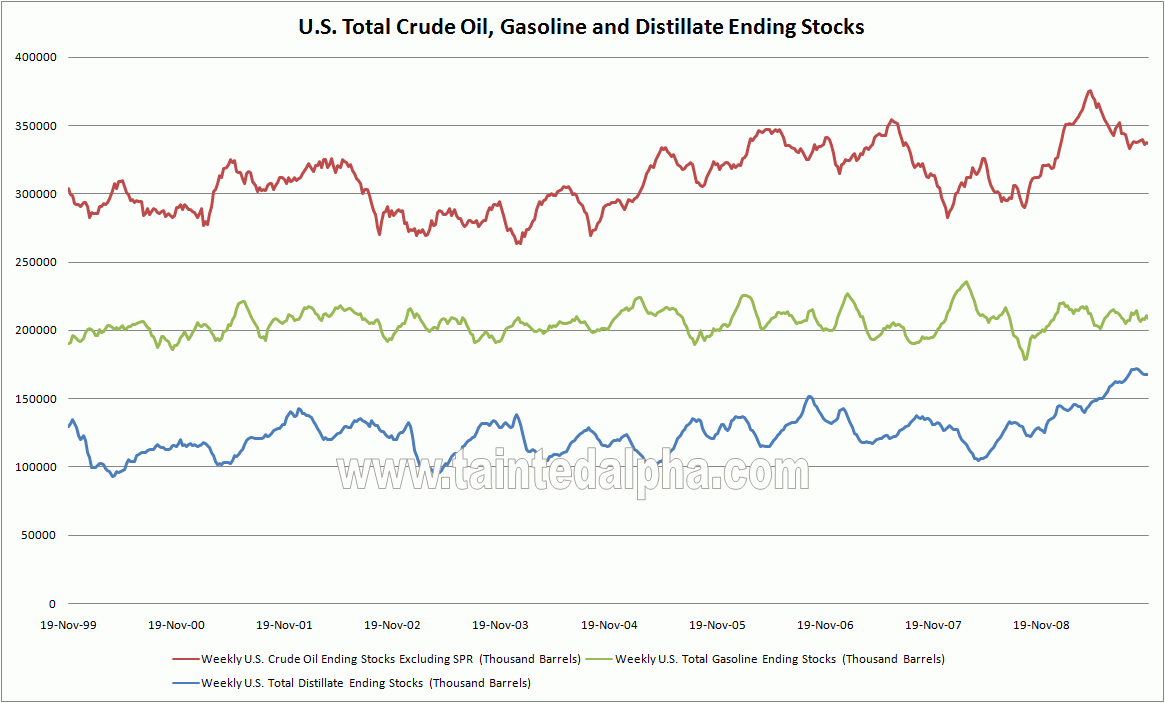
Crude oil stocks rose 0.9 million barrels. Gasoline stocks fell 1.8 million barrels. Distillate stocks fell 0.3 million barrels. Other oil stocks edged higher 2.8 million barrels. Total stocks down 4.2 million barrels.
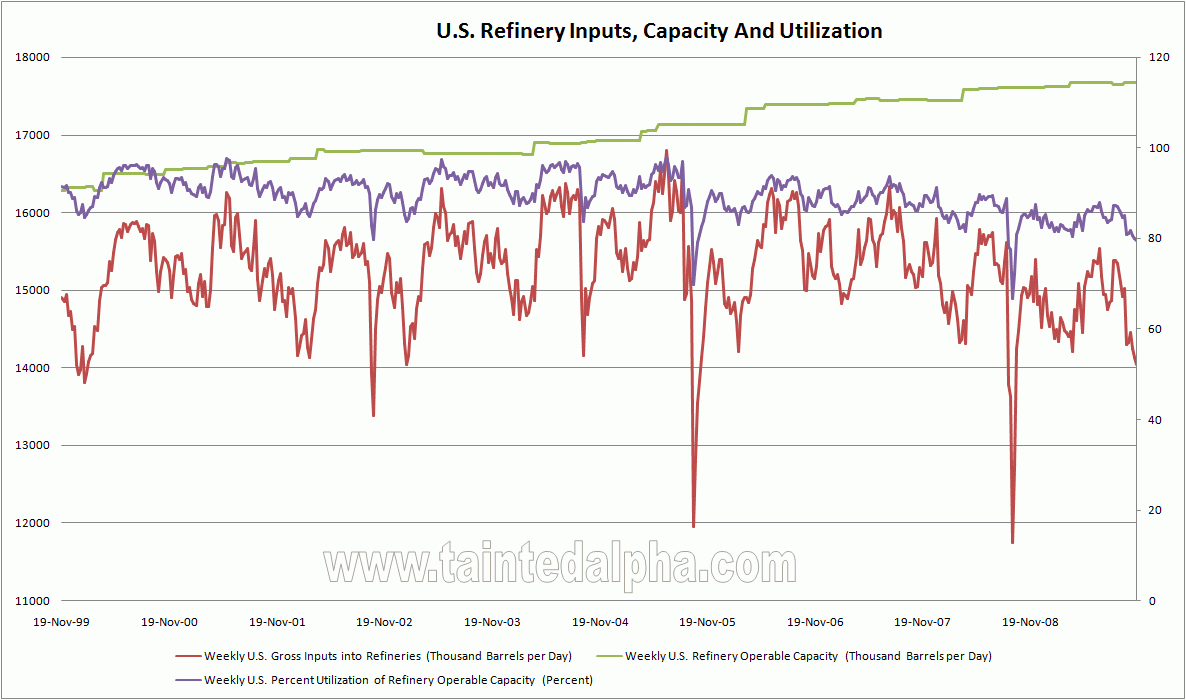
Refinery utilization rate has hit the new low of 79.44% vs. 79.93% the week before. Refinery inputs fell to 14 million barrels, hitting new low.
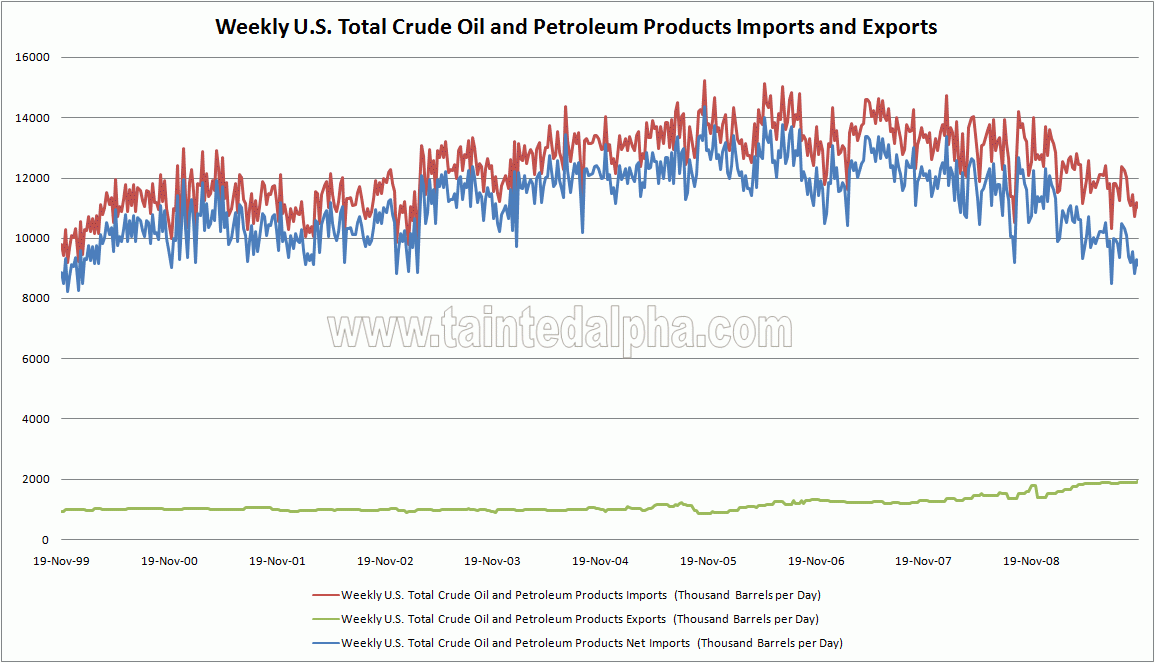
Crude oil and petroleum products exports hitting new high of 2 million barrels; both total and net imports flirting at extremly low levels.
We have low utilization of refineries, low imports and still no meaningful draw out of the stocks. I have no idea where oil being pumped at only 3 million barrels lower rate (-3,5%) from the peaks ends with IE U.S. demand running at -10% from the pre-recession level demand. Maybe Chinese stockpiling.
Chart 1. Change in U.S. Crude Oil and Distillates Stocks
 e
eSource: EIA
Chart 2. U.S. Total Crude Oil, Gasoline and Distillate Ending Stocks
Chart 3. U.S. Refinery Inputs, Capacity And Utilization
Chart 4. Weekly U.S. Total Crude Oil and Petroleum Products Imports and Exports


